Home Equity Since 2020 by Purchase Year: Metro Vancouver, Fraser Valley and Major Canadian Cities (2026)
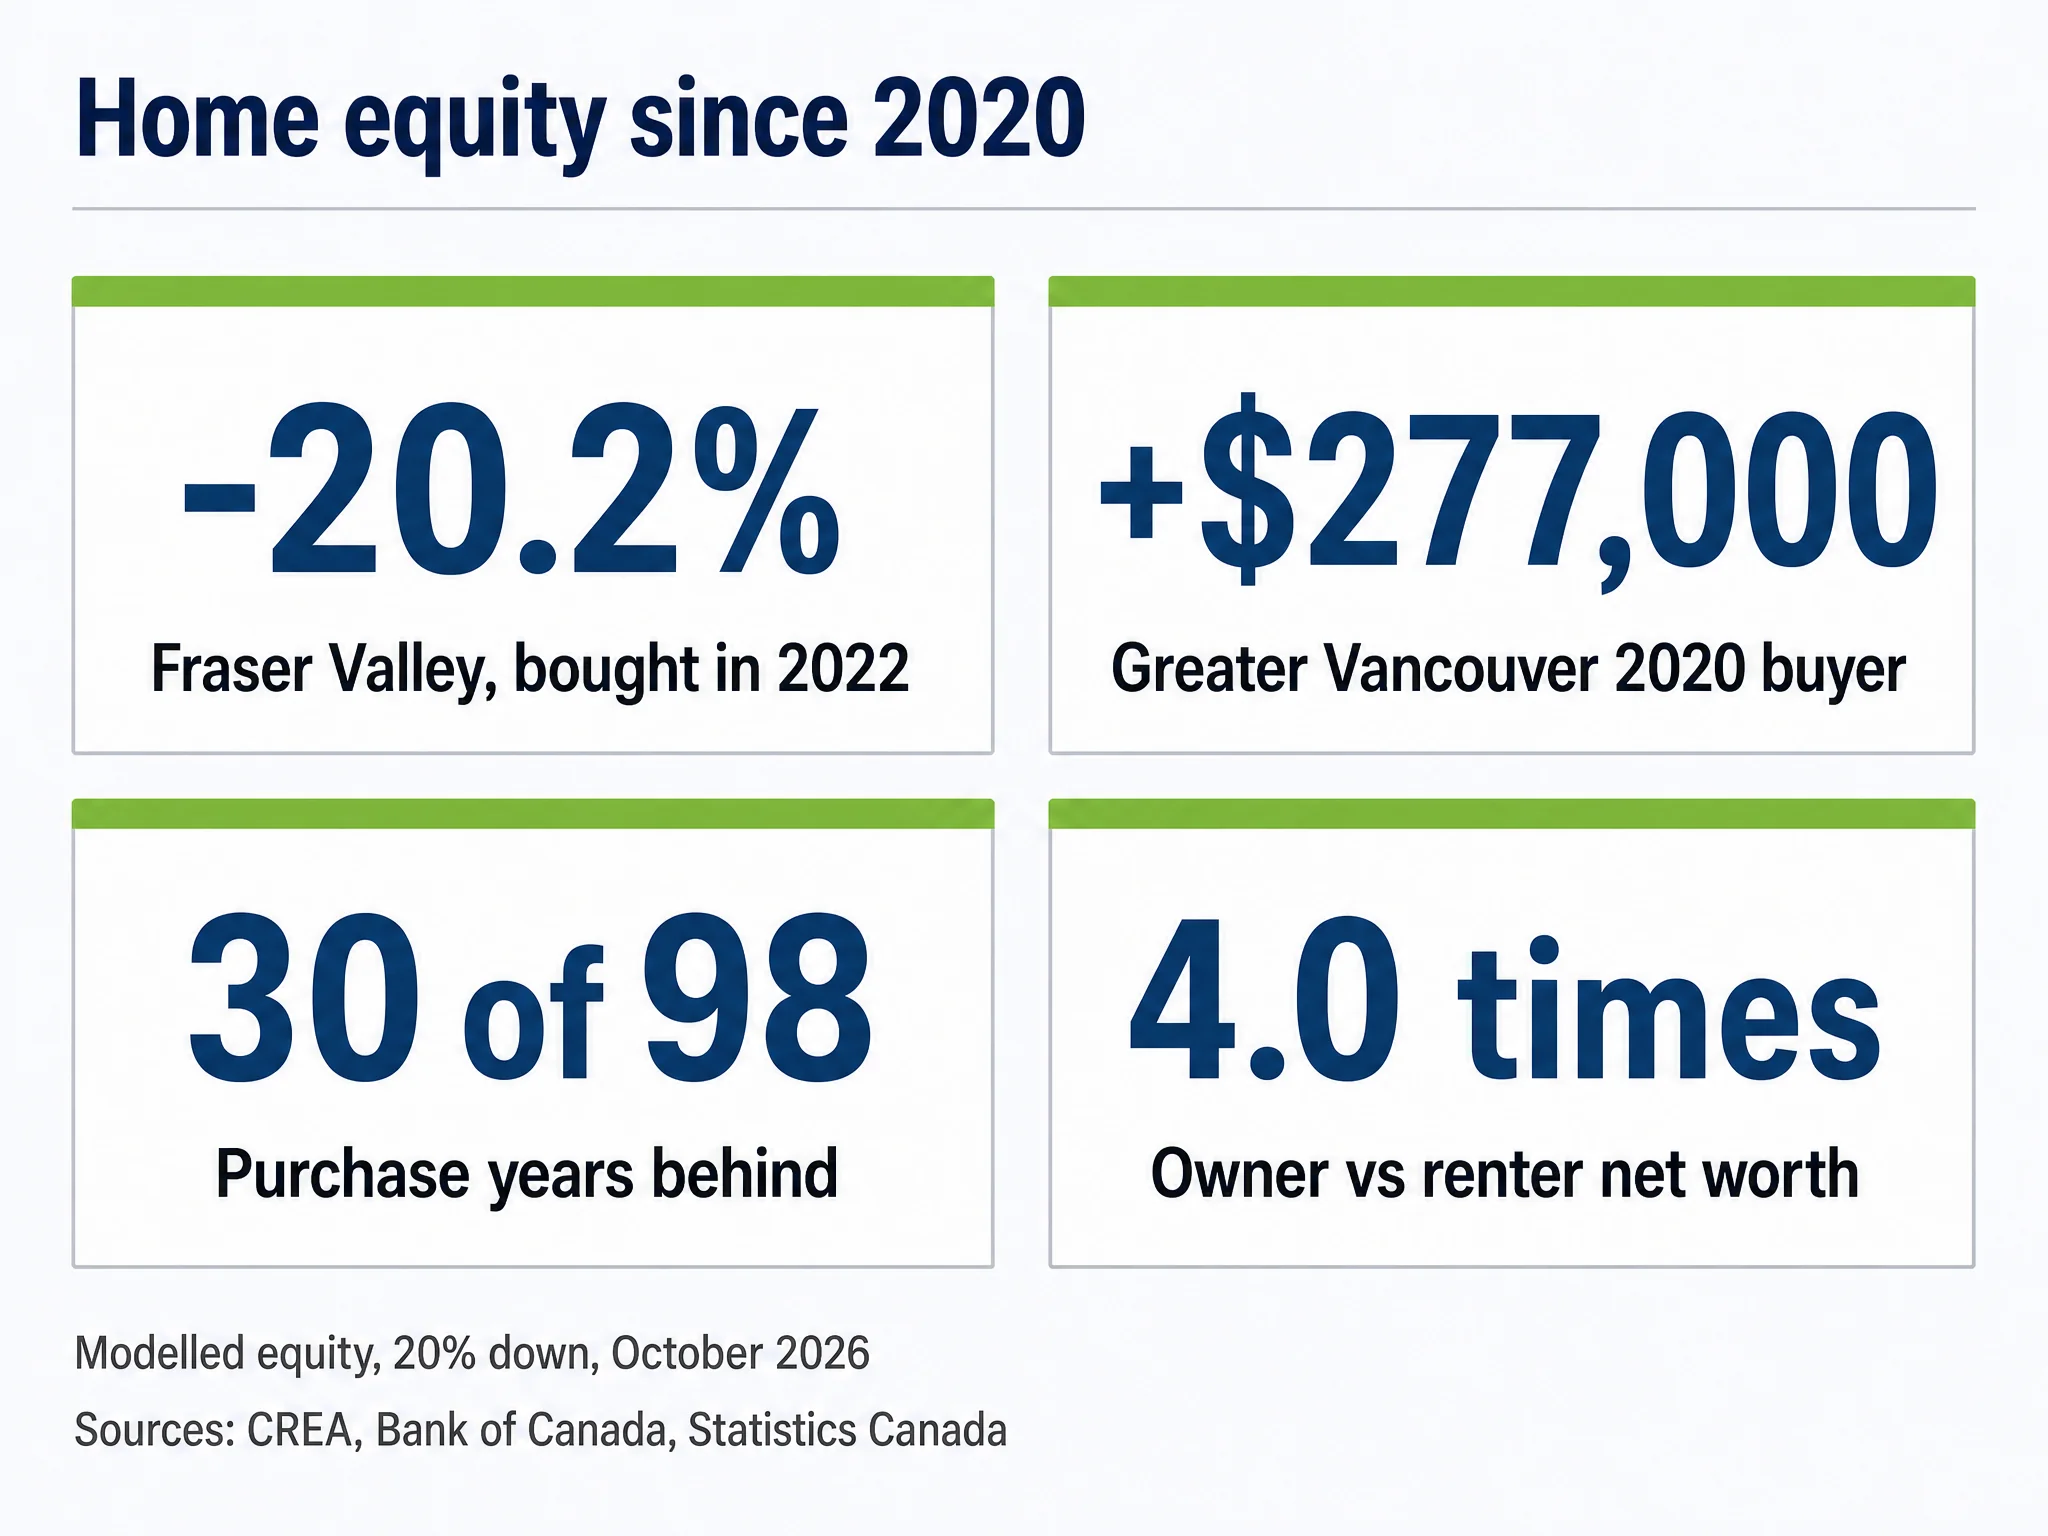
-20.2%: A typical Fraser Valley home bought in 2022 is worth 20.2% less in October 2026, the deepest drop of any purchase year from 2020 to 2026 in the 13 Canadian markets and the national composite measured. Source: Strawhomes calculation from CREA MLS Home Price Index data (2026)
Key Takeaways
- +$277,000 is the modelled equity gained by a 2020 Greater Vancouver buyer with 20% down; a 2022 buyer is at -$13,000 after four years of payments. (Strawhomes equity model: CREA MLS Home Price Index and Bank of Canada mortgage rates, 2026)
- 30 of 98 market and purchase-year combinations from 2020 to 2026 show negative modelled equity gained with 20% down (13 markets plus the national composite). (Strawhomes equity model: CREA MLS Home Price Index and Bank of Canada mortgage rates, 2026)
- +40.8% is the price change for Quebec City buyers of 2022, the best result for that purchase year; Greater Toronto 2022 buyers are at -19.8%. (Strawhomes calculation from CREA MLS Home Price Index data, 2026)
- -18.1% is the North Surrey benchmark change since October 2021, the deepest of 28 Greater Vancouver and Fraser Valley board areas; Squamish leads at +7.4%. (Fraser Valley Real Estate Board, October 2026 statistics package, 2026)
- 7 of 12 2025 purchase months in Greater Vancouver leave a minimum-down-payment buyer with negative modelled equity in October 2026. (Strawhomes equity model: CREA MLS Home Price Index and Bank of Canada mortgage rates, 2026)
- 4.0 times the average renter household's net worth: owners averaged $1,407,787 in Q4 2025, renters $355,473. (Strawhomes calculation from Statistics Canada table 36-10-0660-01, 2026)
Whether owning a home built wealth since 2020 depends less on the city than on the year you bought. A typical Fraser Valley home bought in 2022 has a benchmark price 20.2% below what was paid (Strawhomes calculation from CREA MLS Home Price Index data, 2026), while the same market's 2020 buyers, who bought in the first year of the COVID-19 pandemic, are at +20.6%. In Greater Vancouver, our model puts the equity gained by a 2020 buyer with 20% down at +$277,000, and a 2022 buyer at -$13,000 after four years of mortgage payments (Strawhomes equity model: CREA MLS Home Price Index and Bank of Canada mortgage rates, 2026).
This article builds that table for every purchase year from 2020 to 2026, for Greater Vancouver and the Fraser Valley by home type and board area, and for 98 market and year combinations across Canada. This coast-to-coast comparison of Canada's housing market then sets the result against Statistics Canada's net worth figures for owners and renters. Our earlier analysis of Metro Vancouver and Fraser Valley home prices against the 2022 peak measures how far each market has fallen from its own top; this one asks what that means for the people who bought on the way up and on the way down.
Equity here is modelled, not reported by any lender: the benchmark price of the purchase month, a stated down payment and the average new mortgage rate of that month, rolled forward to the October 2026 benchmark. The new data behind it is CREA's November 2026 release, and the data shows that no single year tells the story for Canadian housing. The assumptions sit under each table and in the methodology, so any figure can be checked or rerun.
How Much Home Equity Did Greater Vancouver and Fraser Valley Homebuyers Gain or Lose Before and After the 2022 Housing Market Peak?
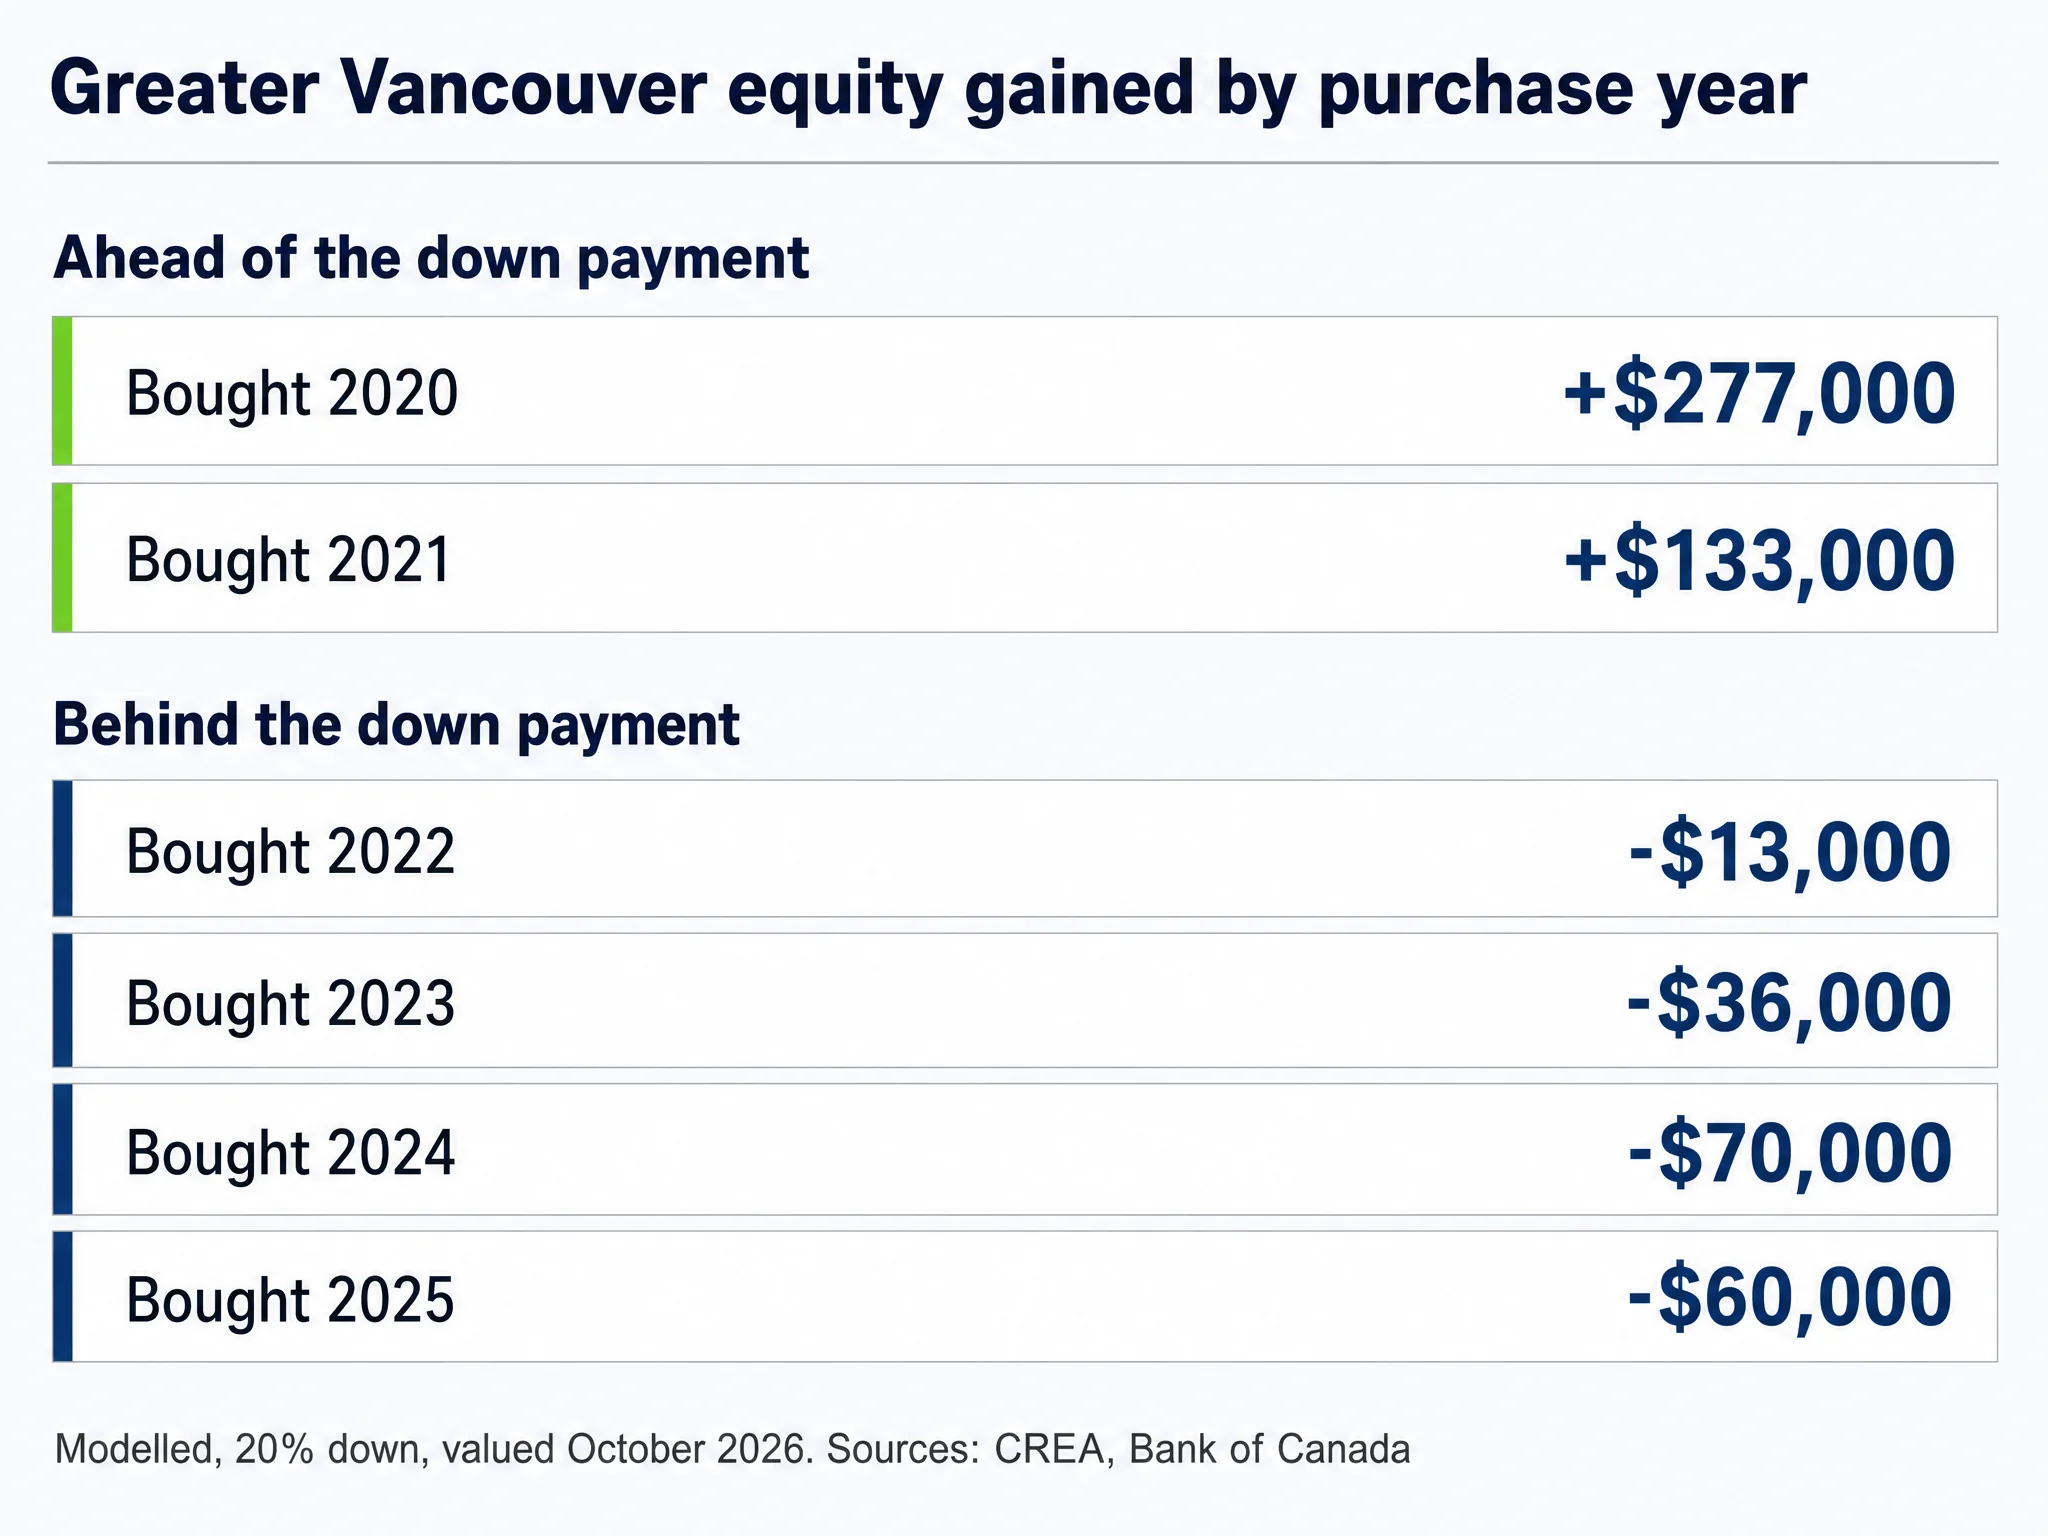
Buyers from 2020 gained the most: +$277,000 of modelled equity in Greater Vancouver and +$255,000 in the Fraser Valley with 20% down. Every purchase year from 2022 on is below its down payment in both markets (Strawhomes equity model: CREA MLS Home Price Index and Bank of Canada mortgage rates, 2026). The Fraser Valley 2022 buyer is at -$120,000.
| Purchase year | Greater Vancouver price paid | Greater Vancouver price change | Greater Vancouver equity gained | Fraser Valley price paid | Fraser Valley price change | Fraser Valley equity gained | Average 5-year fixed rate | Source |
|---|---|---|---|---|---|---|---|---|
| 2020 | $933,400 | +14.5% | +$277,000 | $712,900 | +20.6% | +$255,000 | 2.47% | Strawhomes equity model: CREA MLS Home Price Index and Bank of Canada mortgage rates |
| 2021 | $1,079,300 | -1.0% | +$133,000 | $916,000 | -6.1% | +$66,000 | 2.18% | Strawhomes equity model: CREA MLS Home Price Index and Bank of Canada mortgage rates |
| 2022 | $1,187,600 | -10.0% | -$13,000 | $1,077,200 | -20.2% | -$120,000 | 3.96% | Strawhomes equity model: CREA MLS Home Price Index and Bank of Canada mortgage rates |
| 2023 | $1,169,100 | -8.6% | -$36,000 | $996,000 | -13.7% | -$81,000 | 5.40% | Strawhomes equity model: CREA MLS Home Price Index and Bank of Canada mortgage rates |
| 2024 | $1,184,000 | -9.7% | -$70,000 | $990,100 | -13.1% | -$92,000 | 5.16% | Strawhomes equity model: CREA MLS Home Price Index and Bank of Canada mortgage rates |
| 2025 | $1,155,600 | -7.5% | -$60,000 | $945,100 | -9.0% | -$63,000 | 4.37% | Strawhomes equity model: CREA MLS Home Price Index and Bank of Canada mortgage rates |
| 2026 (January to September) | $1,094,500 | -2.4% | -$18,000 | $886,300 | -3.0% | -$20,000 | 4.38% | Strawhomes equity model: CREA MLS Home Price Index and Bank of Canada mortgage rates |
- 2020, Greater Vancouver: $277,000
- 2020, Fraser Valley: $255,000
- 2021, Greater Vancouver: $133,000
- 2021, Fraser Valley: $66,000
- 2022, Greater Vancouver: -$13,000
- 2022, Fraser Valley: -$120,000
- 2023, Greater Vancouver: -$36,000
- 2023, Fraser Valley: -$81,000
- 2024, Greater Vancouver: -$70,000
- 2024, Fraser Valley: -$92,000
- 2025, Greater Vancouver: -$60,000
- 2025, Fraser Valley: -$63,000
- 2026 (Jan-Sep), Greater Vancouver: -$18,000
- 2026 (Jan-Sep), Fraser Valley: -$20,000
$106,000: of principal repaid by a 2022 Greater Vancouver buyer with 20% down, which offsets part of a -$119,000 price change. (Strawhomes equity model: CREA MLS Home Price Index and Bank of Canada mortgage rates, 2026)
Price paid is the average of the monthly MLS Home Price Index benchmarks in the purchase year, and the October 2026 benchmark is $1,068,600 in Greater Vancouver and $860,000 in the Fraser Valley (Canadian Real Estate Association, MLS Home Price Index data, November 2026 release, 2026). Prices declined after 2022, and prices remain below the 2022 average in both markets. Equity gained is the price change plus the principal repaid, so it can be negative even when the owner still has equity: a 2022 Greater Vancouver buyer put down $238,000 and holds about $225,000 today.
The rate column matters as much as the price. Buyers of 2020 and 2021 locked in around 2.47% and 2.18% and paid down principal quickly, while 2023 buyers took the highest rate in the period, 5.40%, and 2024 buyers 5.16%, so more of each payment went to interest (Strawhomes calculation from Bank of Canada A4 mortgage rates, 2024). Our look at fixed vs variable mortgages in Canada covers how those rate cycles played out. None of these figures count the cost of buying or selling, which in BC adds property transfer tax on the way in and commission on the way out; the cost of selling a house in BC would come off any gain.
Which Home Types Lost the Most Equity? The Home Price Trend for Houses, Townhouses and Condos Since 2020
Detached houses swung the most in dollars: modelled equity gained by Greater Vancouver house buyers runs from +$496,000 for 2020 to -$146,000 for 2024. Greater Vancouver houses bought in 2020 are at +17.6%, but those bought in 2022 are at -9.6% (Strawhomes calculation from CREA MLS Home Price Index data, 2026). Fraser Valley houses from 2022 are at -18.2%. Townhouses bought in 2022 fell least in both markets.
| Market and type | Bought 2020 | Bought 2021 | Bought 2022 | Bought 2023 | Bought 2024 | Bought 2025 | Bought 2026 (January to September) | Source |
|---|---|---|---|---|---|---|---|---|
| Greater Vancouver, houses | +17.6% | -0.5% | -9.6% | -7.8% | -11.1% | -9.1% | -3.0% | Strawhomes calculation from CREA MLS Home Price Index data |
| Greater Vancouver, townhouses | +25.2% | +7.9% | -6.9% | -7.1% | -9.6% | -7.5% | -3.1% | Strawhomes calculation from CREA MLS Home Price Index data |
| Greater Vancouver, condos | +8.4% | +0.4% | -9.3% | -10.6% | -12.1% | -9.1% | -3.4% | Strawhomes calculation from CREA MLS Home Price Index data |
| Fraser Valley, houses | +25.0% | -4.5% | -18.2% | -11.7% | -14.2% | -11.2% | -4.3% | Strawhomes calculation from CREA MLS Home Price Index data |
| Fraser Valley, townhouses | +28.8% | +5.4% | -13.7% | -9.8% | -11.8% | -8.6% | -2.8% | Strawhomes calculation from CREA MLS Home Price Index data |
| Fraser Valley, condos | +20.7% | +3.4% | -15.0% | -13.3% | -15.3% | -11.1% | -3.9% | Strawhomes calculation from CREA MLS Home Price Index data |
-$155,000: modelled equity gained by a 2024 Fraser Valley house buyer with 20% down, the largest dollar loss of any type and purchase year in either market. (Strawhomes equity model: CREA MLS Home Price Index and Bank of Canada mortgage rates, 2026)
Condos tell a quieter story. A Greater Vancouver condo bought in 2020 is at +8.4%, and one bought in 2022 is at -9.3%, a smaller fall than for houses but with less gain before it: for 2020 and 2022 buyers, condo prices moved less than house prices in both directions. Because a condo costs less, the dollar swing is smaller too: modelled equity gained by a 2022 condo buyer is -$3,000, against -$13,000 for a house (Strawhomes equity model: CREA MLS Home Price Index and Bank of Canada mortgage rates, 2026).
Townhouses bought in 2022 show the smallest losses: Greater Vancouver townhouses are at -6.9% and Fraser Valley townhouses at -13.7%. These are board-wide benchmarks; a specific building or street can sit well above or below its type, and a real estate appraisal of one home can differ from the benchmark.
Bought in 2021, 2023 or 2025: Price Change by City in Metro Vancouver, Surrey and the Fraser Valley
25 of 28 board areas have a lower benchmark than in October 2021 (Strawhomes calculation from Greater Vancouver REALTORS, October 2026, 2026). North Surrey is at -18.1% and Mission -16.2%; Squamish is at +7.4%. Since October 2025, every area is lower, led by Mission at -11.9%.
- North Surrey: -18.1%
- Mission: -16.2%
- West Vancouver: -14.3%
- Surrey: -13.6%
- Abbotsford: -13.3%
- South Surrey & White Rock: -12.9%
- North Delta: -11.8%
- Maple Ridge: -8.8%
- Coquitlam: -7.5%
- Vancouver West: -6.8%
- Burnaby North: -6.7%
- Cloverdale: -6.4%
- Pitt Meadows: 0.1%
- Vancouver East: 0.4%
- Squamish: 7.4%
- Reference line, Greater Vancouver board area: -4.0%
6: of 28 areas leave an October 2021 buyer with 20% down below their down payment: West Vancouver, North Surrey, Surrey, South Surrey and White Rock, Abbotsford and Mission. (Strawhomes calculation from Greater Vancouver REALTORS, October 2026, 2026)
The three columns are the boards' own one-year (year-over-year), three-year and five-year changes, printed in their October 2026 releases, so each reads as the result for someone who bought in that October (Fraser Valley Real Estate Board, October 2026 statistics package, 2026). The equity column uses the October 2021 rate of 2.22% with 20% down. Surrey and Langley sit in the Fraser Valley board, not Greater Vancouver; the Surrey market stats track sales there month by month.
The Fraser Valley board areas fell further over five years than most of Greater Vancouver: Abbotsford is at -13.3% and the Fraser Valley board area at -11.4%, against -4.0% for Greater Vancouver. City-level sales, prices and inventory are on our real estate market stats pages, and the calculator below lists the benchmark for every area and home type.
How Does Vancouver Compare With Toronto (GTA), Calgary, Montreal and Other Major Canadian Markets?
Of 98 market and purchase-year combinations, 30 show negative modelled equity gained with 20% down (Strawhomes equity model: CREA MLS Home Price Index and Bank of Canada mortgage rates, 2026). Losses cluster in Greater Vancouver, the Fraser Valley, Greater Toronto and Hamilton-Burlington. Calgary, Montreal, Quebec City and the Prairies show gains for almost every purchase year.
- Fraser Valley: -20.2%
- Greater Toronto: -19.8%
- Hamilton: -19.1%
- Greater Vancouver: -10.0%
- Victoria: -4.3%
- Ottawa: -4.2%
- Edmonton: 6.9%
- Halifax-Dartmouth: 8.1%
- Calgary: 11.4%
- Winnipeg: 12.0%
- Montreal: 13.5%
- Saskatoon: 18.8%
- Quebec City: 40.8%
- Reference line, Canada: -15.0%
+40.8%: price change for Quebec City buyers of 2022, the best result for that purchase year among the markets measured. (Strawhomes calculation from CREA MLS Home Price Index data, 2026)
The national composite peaked in March 2022 at $841,500 and is -22.8% from there (Strawhomes calculation from CREA MLS Home Price Index data, 2026). That makes 2022 the worst purchase year on price in Greater Vancouver, the Fraser Valley, Victoria, Greater Toronto, Hamilton-Burlington, Ottawa and the national composite. Toronto and Vancouver buyers of 2022 are both behind: Greater Toronto is at -19.8% on price and -$123,000 on modelled equity. How the 2022 to 2023 interest rate rise affected the housing market differed by city is visible in this table: in Calgary and Edmonton in Alberta, the other Prairie cities, Montreal, Quebec City and Halifax-Dartmouth the weakest purchase year is 2024 or later, because price growth in those more affordable markets continued through the 2022 to 2023 slowdown in demand.
Even in the weakest markets, buyers from 2020 are ahead. Price gains for 2020 buyers run from +8.1% in Greater Toronto to +76.8% in Quebec City. In 4 of the 13 markets a 2022 buyer is behind on modelled equity. Our ranking of the most expensive cities in Canada sets the price levels behind these swings side by side.
Could Buying Now Leave a Buyer Underwater? Equity at the Minimum Down Payment After Higher Borrowing Costs
With the minimum down payment, 5 of 13 markets have at least one 2025 purchase month with negative modelled equity in October 2026 (Strawhomes equity model: CREA MLS Home Price Index and Bank of Canada mortgage rates, 2026). In Greater Vancouver it is 7 of 12 months, in the Fraser Valley 11 of 12.
- Fraser Valley: -$22,000
- Greater Vancouver: -$5,000
- Greater Toronto: -$3,000
- Hamilton: $4,000
- Edmonton: $8,000
- Calgary: $21,000
- Ottawa: $22,000
- Halifax-Dartmouth: $23,000
- Winnipeg: $26,000
- Saskatoon: $29,000
- Montreal: $44,000
- Quebec City: $49,000
- Victoria: $50,000
- Reference line, Canada: $5,000
4.00%: CMHC premium at a 90.01% to 95% loan-to-value, which we add to the loan; it starts every minimum-down purchase with a balance above the price paid less the down payment. (CMHC, mortgage loan insurance premiums, 2026)
The minimum down payment is 5% of the first $500,000 and 10% of the rest (CMHC, what is mortgage loan insurance, 2026), and insured mortgages are capped at $1.5 million since December 15, 2024, up from $1 million (CMHC, results for Q3 2024 news release, 2024). The insured rate is the Bank of Canada average for insured 5-year-plus fixed loans, 4.03% in 2025. How that rate compares with the uninsured one is covered in insured vs uninsured mortgage rates.
A buyer with the minimum down payment starts with little room: the premium alone is 4.00% of the loan, so a small price drop wipes out the stake. First-time buyers who purchase a home with the smallest stake the rules allow face exactly this. Negative equity only costs money when the owner has to sell or refinance through a lender or mortgage broker; a buyer who keeps paying and stays put has not realised a loss. Federal policy shapes this case directly: where a market's benchmark was at or above the old $1 million cap in any month of a year, as in Greater Vancouver, Greater Toronto and the Fraser Valley from 2021 to 2024, that year cannot be modelled at the minimum and shows only the 20% case.
Owners vs Renters: Did Homeownership Build More Net Worth Than Renting for Canadians?
Owner households averaged $1,407,787 of net worth in Q4 2025, renters $355,473: 4.0 times as much (Strawhomes calculation from Statistics Canada table 36-10-0660-01, 2026). The ratio was 4.9 times in Q4 2019. Renter net worth grew faster in percent (+63.5% against +31.9%), but owners added more dollars.
| Household | Q4 2019 | Q4 2021 | Q4 2025 | Change since Q4 2019 | Change, percent | Source |
|---|---|---|---|---|---|---|
| All households | $787,010 | $1,031,500 | $1,078,642 | +$292,000 | +37.1% | Statistics Canada, Distributions of household economic accounts, table 36-10-0660-01 |
| Owners | $1,067,131 | $1,366,230 | $1,407,787 | +$341,000 | +31.9% | Statistics Canada, Distributions of household economic accounts, table 36-10-0660-01 |
| Owners with a mortgage | $754,049 | $1,053,399 | $1,052,195 | +$298,000 | +39.5% | Statistics Canada, Distributions of household economic accounts, table 36-10-0660-01 |
| Owners without a mortgage | $1,441,685 | $1,750,898 | $1,852,000 | +$410,000 | +28.5% | Statistics Canada, Distributions of household economic accounts, table 36-10-0660-01 |
| Renters | $217,366 | $308,387 | $355,473 | +$138,000 | +63.5% | Statistics Canada, Distributions of household economic accounts, table 36-10-0660-01 |
$1,052,000: gap between average owner and renter net worth in Q4 2025, up from $850,000 in Q4 2019. (Strawhomes calculation from Statistics Canada table 36-10-0660-01, 2026)
- Renters: $355,473
- Owners with a mortgage: $1,052,195
- All households: $1,078,642
- Owners: $1,407,787
- Owners without a mortgage: $1,852,000
Owners' average real estate assets were higher in Q4 2021, at $791,529, than in Q4 2025, at $725,214, a change of -8.4% (Statistics Canada, Distributions of household economic accounts, table 36-10-0660-01, 2026). Their net worth still rose, by +3.0% from Q4 2021, because their other assets grew while home values slipped. Average owner mortgage debt was $198,108.
These are averages, which the richest households pull up; our note on average vs median explains why the two differ. Owners are also older on average and have had more years to save, so the gap is not all down to home ownership. The buy or rent question in Vancouver turns on the purchase year as much as on rent: the table above shows the 2020 cohort ahead and the 2022 cohort behind.
Home Price Checker: Benchmark and Change Since 2021 by Area and Home Type
Home Price Checker: Benchmark and Change Since 2021 by Area and Home Type
Enter a price to see the Greater Vancouver and Fraser Valley board areas and home types whose October 2026 benchmark is at or below it, with the change since October 2025, 2023 and 2021.
| Area | Benchmark, October 2026 | Home type | Since October 2025 | Since October 2023 | Since October 2021 |
|---|---|---|---|---|---|
| North Surrey (Fraser Valley Real Estate Board) | $637,000 | All homes | -7.2% | -19.4% | -18.1% |
| Abbotsford (Fraser Valley Real Estate Board) | $702,800 | All homes | -9.9% | -11.5% | -13.3% |
| New Westminster (Greater Vancouver REALTORS) | $707,200 | All homes | -8.8% | -14.5% | -3.9% |
| Mission (Fraser Valley Real Estate Board) | $787,800 | All homes | -11.9% | -14% | -16.2% |
| Sunshine Coast (Greater Vancouver REALTORS) | $801,700 | All homes | -1.8% | -2.9% | -0.3% |
| Pitt Meadows (Greater Vancouver REALTORS) | $832,600 | All homes | -4% | -7.4% | 0.1% |
| Port Coquitlam (Greater Vancouver REALTORS) | $840,200 | All homes | -6.9% | -10.8% | -0.9% |
| Fraser Valley board area (Fraser Valley Real Estate Board) | $860,000 | All homes | -6.4% | -14.7% | -11.4% |
| Maple Ridge (Greater Vancouver REALTORS) | $864,000 | All homes | -8.4% | -12.4% | -8.8% |
| Burnaby North (Greater Vancouver REALTORS) | $875,000 | All homes | -5.8% | -14.1% | -6.7% |
| Surrey (Fraser Valley Real Estate Board) | $899,900 | All homes | -7% | -17.9% | -13.6% |
| Cloverdale (Fraser Valley Real Estate Board) | $930,600 | All homes | -4.6% | -9.6% | -6.4% |
| Langley (Fraser Valley Real Estate Board) | $932,900 | All homes | -5.7% | -10.4% | -4.9% |
| Coquitlam (Greater Vancouver REALTORS) | $957,500 | All homes | -7.1% | -13.5% | -7.5% |
| Burnaby East (Greater Vancouver REALTORS) | $972,500 | All homes | -7.1% | -16% | -5.9% |
| Burnaby South (Greater Vancouver REALTORS) | $975,400 | All homes | -6.1% | -12.7% | -3.5% |
| Port Moody (Greater Vancouver REALTORS) | $995,800 | All homes | -6.6% | -11.3% | -2.6% |
| South Surrey & White Rock (Fraser Valley Real Estate Board) | $996,000 | All homes | -5.4% | -19.4% | -12.9% |
| Richmond (Greater Vancouver REALTORS) | $998,300 | All homes | -8.3% | -14.9% | -5.6% |
| Ladner (Greater Vancouver REALTORS) | $1,023,500 | All homes | -6.5% | -11.4% | -2.6% |
| North Delta (Fraser Valley Real Estate Board) | $1,024,900 | All homes | -6.8% | -15% | -11.8% |
| Greater Vancouver (Greater Vancouver REALTORS) | $1,068,600 | All homes | -5.2% | -10.1% | -4% |
| Squamish (Greater Vancouver REALTORS) | $1,100,500 | All homes | -1.6% | 3.2% | 7.4% |
| Tsawwassen (Greater Vancouver REALTORS) | $1,103,800 | All homes | -1.4% | -9.4% | -3.3% |
| Vancouver East (Greater Vancouver REALTORS) | $1,121,600 | All homes | -4.4% | -7.7% | 0.4% |
| Vancouver West (Greater Vancouver REALTORS) | $1,196,600 | All homes | -4.5% | -8.9% | -6.8% |
| North Vancouver (Greater Vancouver REALTORS) | $1,281,400 | All homes | -2.7% | -6.5% | -0.2% |
| Whistler (Greater Vancouver REALTORS) | $1,359,000 | All homes | -1.3% | -4.9% | -4.1% |
| Bowen Island (Greater Vancouver REALTORS) | $1,395,700 | All homes | -0.5% | -4.2% | -4.7% |
| West Vancouver (Greater Vancouver REALTORS) | $2,299,200 | All homes | -3.5% | -13% | -14.3% |
| Sunshine Coast (Greater Vancouver REALTORS) | $850,200 | Houses | -2.1% | -3.3% | -2% |
| Mission (Fraser Valley Real Estate Board) | $883,300 | Houses | -13.1% | -10.8% | -13.8% |
| Abbotsford (Fraser Valley Real Estate Board) | $1,090,500 | Houses | -13.1% | -9.1% | -12.4% |
| Maple Ridge (Greater Vancouver REALTORS) | $1,138,500 | Houses | -8.6% | -10.7% | -7.4% |
| North Delta (Fraser Valley Real Estate Board) | $1,165,900 | Houses | -9.2% | -15.7% | -13% |
| Pitt Meadows (Greater Vancouver REALTORS) | $1,172,600 | Houses | -1.3% | -8.8% | -6.2% |
| Port Coquitlam (Greater Vancouver REALTORS) | $1,235,900 | Houses | -8.4% | -10.4% | -2.5% |
| North Surrey (Fraser Valley Real Estate Board) | $1,254,500 | Houses | -9.8% | -15% | -11.9% |
| Ladner (Greater Vancouver REALTORS) | $1,262,500 | Houses | -4.3% | -10.1% | -3.3% |
| Surrey (Fraser Valley Real Estate Board) | $1,288,000 | Houses | -8.9% | -17.2% | -11.6% |
| Fraser Valley board area (Fraser Valley Real Estate Board) | $1,293,800 | Houses | -8.5% | -13.6% | -10.1% |
| Cloverdale (Fraser Valley Real Estate Board) | $1,326,400 | Houses | -6% | -8.6% | -7.9% |
| New Westminster (Greater Vancouver REALTORS) | $1,347,700 | Houses | -9.9% | -13.1% | -4.8% |
| Bowen Island (Greater Vancouver REALTORS) | $1,398,200 | Houses | -0.6% | -4.3% | -4.8% |
| Langley (Fraser Valley Real Estate Board) | $1,448,100 | Houses | -6.5% | -10.8% | -7.2% |
| Tsawwassen (Greater Vancouver REALTORS) | $1,469,500 | Houses | 0.7% | -6.8% | -0.9% |
| Coquitlam (Greater Vancouver REALTORS) | $1,571,400 | Houses | -7% | -12.1% | -3.3% |
| South Surrey & White Rock (Fraser Valley Real Estate Board) | $1,606,500 | Houses | -6.3% | -16.5% | -9% |
| Vancouver East (Greater Vancouver REALTORS) | $1,610,700 | Houses | -8.3% | -14.1% | -5.6% |
| Burnaby East (Greater Vancouver REALTORS) | $1,681,600 | Houses | -7.2% | -10.1% | 1.6% |
| Squamish (Greater Vancouver REALTORS) | $1,681,800 | Houses | 0.7% | 9.7% | 7.6% |
| Greater Vancouver (Greater Vancouver REALTORS) | $1,775,200 | Houses | -7% | -10.5% | -3.9% |
| Burnaby North (Greater Vancouver REALTORS) | $1,795,200 | Houses | -7.1% | -11.6% | 1.6% |
| Richmond (Greater Vancouver REALTORS) | $1,833,100 | Houses | -11.1% | -15.1% | -7.7% |
| Port Moody (Greater Vancouver REALTORS) | $1,868,000 | Houses | -9.3% | -9.8% | 0.5% |
| Burnaby South (Greater Vancouver REALTORS) | $1,904,400 | Houses | -8.8% | -11% | -0.7% |
| North Vancouver (Greater Vancouver REALTORS) | $2,058,800 | Houses | -2.2% | -7.5% | -0.2% |
| Whistler (Greater Vancouver REALTORS) | $2,646,200 | Houses | 2.2% | 5.4% | 0.7% |
| West Vancouver (Greater Vancouver REALTORS) | $2,864,900 | Houses | -7.2% | -13.2% | -11% |
| Vancouver West (Greater Vancouver REALTORS) | $2,899,700 | Houses | -9% | -14% | -12.8% |
| Abbotsford (Fraser Valley Real Estate Board) | $579,600 | Townhouses | -10.1% | -10.3% | -3.2% |
| Mission (Fraser Valley Real Estate Board) | $606,100 | Townhouses | -6.1% | -6% | 2.1% |
| North Surrey (Fraser Valley Real Estate Board) | $671,000 | Townhouses | -3.4% | -14.5% | 0.4% |
| Maple Ridge (Greater Vancouver REALTORS) | $686,600 | Townhouses | -9.5% | -11.3% | -3.4% |
| Sunshine Coast (Greater Vancouver REALTORS) | $708,600 | Townhouses | -5.9% | -6.5% | 8.2% |
| Pitt Meadows (Greater Vancouver REALTORS) | $731,800 | Townhouses | -7.8% | -10.3% | 0.8% |
| Fraser Valley board area (Fraser Valley Real Estate Board) | $742,300 | Townhouses | -5.5% | -12.1% | -1% |
| Surrey (Fraser Valley Real Estate Board) | $744,300 | Townhouses | -4.5% | -12.1% | -1.3% |
| Cloverdale (Fraser Valley Real Estate Board) | $757,900 | Townhouses | -4.4% | -10.5% | -2.5% |
| Langley (Fraser Valley Real Estate Board) | $800,600 | Townhouses | -3.7% | -8.6% | 6% |
| South Surrey & White Rock (Fraser Valley Real Estate Board) | $800,900 | Townhouses | -9.2% | -17.6% | -8% |
| Burnaby East (Greater Vancouver REALTORS) | $839,300 | Townhouses | -4.9% | -6.8% | 12.5% |
| New Westminster (Greater Vancouver REALTORS) | $852,000 | Townhouses | -5.3% | -10.4% | 5.5% |
| Port Coquitlam (Greater Vancouver REALTORS) | $854,900 | Townhouses | -3.3% | -9.7% | 2.6% |
| North Delta (Fraser Valley Real Estate Board) | $867,500 | Townhouses | -1.4% | -11.7% | 1.5% |
| Burnaby North (Greater Vancouver REALTORS) | $873,000 | Townhouses | -5.3% | -5.1% | 8.7% |
| Tsawwassen (Greater Vancouver REALTORS) | $878,400 | Townhouses | -7.4% | -13.9% | -3.9% |
| Port Moody (Greater Vancouver REALTORS) | $895,800 | Townhouses | -10.1% | -13% | -0.4% |
| Ladner (Greater Vancouver REALTORS) | $909,300 | Townhouses | -10.2% | -10.8% | 3.9% |
| Burnaby South (Greater Vancouver REALTORS) | $922,900 | Townhouses | -7.8% | -9.9% | 4.6% |
| Coquitlam (Greater Vancouver REALTORS) | $962,600 | Townhouses | -6.6% | -9.2% | 3.3% |
| Squamish (Greater Vancouver REALTORS) | $968,600 | Townhouses | -6.2% | -5.7% | 7.4% |
| Greater Vancouver (Greater Vancouver REALTORS) | $1,006,500 | Townhouses | -5.5% | -8.7% | 3.6% |
| Richmond (Greater Vancouver REALTORS) | $1,009,300 | Townhouses | -4.5% | -9.8% | 4.9% |
| Vancouver East (Greater Vancouver REALTORS) | $1,055,800 | Townhouses | 0.4% | -4.5% | 2.9% |
| North Vancouver (Greater Vancouver REALTORS) | $1,221,100 | Townhouses | -5.9% | -9.2% | 2.4% |
| Vancouver West (Greater Vancouver REALTORS) | $1,285,000 | Townhouses | -5.7% | -10.1% | -3.3% |
| Whistler (Greater Vancouver REALTORS) | $1,621,200 | Townhouses | -5.4% | -5.8% | 10% |
| Abbotsford (Fraser Valley Real Estate Board) | $370,300 | Condos | -10% | -13.7% | -0.8% |
| North Surrey (Fraser Valley Real Estate Board) | $392,300 | Condos | -10.2% | -20% | -8.6% |
| Mission (Fraser Valley Real Estate Board) | $396,200 | Condos | -8.2% | -12% | 3.1% |
| Surrey (Fraser Valley Real Estate Board) | $453,600 | Condos | -12.2% | -16.9% | -0.3% |
| Fraser Valley board area (Fraser Valley Real Estate Board) | $460,800 | Condos | -8.1% | -14.6% | -1.1% |
| Sunshine Coast (Greater Vancouver REALTORS) | $462,300 | Condos | -5.4% | -16.8% | -15.3% |
| North Delta (Fraser Valley Real Estate Board) | $475,700 | Condos | -11.2% | -16.9% | -2.6% |
| Maple Ridge (Greater Vancouver REALTORS) | $481,600 | Condos | -8.3% | -13.7% | -0.3% |
| Cloverdale (Fraser Valley Real Estate Board) | $501,800 | Condos | -8.9% | -12.5% | -3.9% |
| Langley (Fraser Valley Real Estate Board) | $522,300 | Condos | -8.4% | -13.6% | 0.5% |
| Pitt Meadows (Greater Vancouver REALTORS) | $523,500 | Condos | -8% | -13.2% | -1.3% |
| Port Coquitlam (Greater Vancouver REALTORS) | $551,200 | Condos | -7.6% | -11.5% | 2.4% |
| South Surrey & White Rock (Fraser Valley Real Estate Board) | $558,600 | Condos | -3.5% | -12.2% | 3.6% |
| New Westminster (Greater Vancouver REALTORS) | $565,900 | Condos | -9.2% | -14.3% | -1.1% |
| Tsawwassen (Greater Vancouver REALTORS) | $588,800 | Condos | -7% | -11.9% | -1.1% |
| Squamish (Greater Vancouver REALTORS) | $599,600 | Condos | -0.1% | -5.8% | 0.3% |
| Whistler (Greater Vancouver REALTORS) | $612,500 | Condos | -4.8% | -16.3% | -7.1% |
| Ladner (Greater Vancouver REALTORS) | $620,000 | Condos | -5.6% | -12.4% | -0.8% |
| Coquitlam (Greater Vancouver REALTORS) | $624,200 | Condos | -9.1% | -13.8% | -2.4% |
| Richmond (Greater Vancouver REALTORS) | $625,700 | Condos | -8.8% | -16.8% | -1.7% |
| Vancouver East (Greater Vancouver REALTORS) | $635,100 | Condos | -3.9% | -10.5% | -2% |
| Burnaby North (Greater Vancouver REALTORS) | $660,400 | Condos | -5.7% | -13.9% | -2.7% |
| Greater Vancouver (Greater Vancouver REALTORS) | $673,400 | Condos | -5.9% | -12.4% | -1.9% |
| Port Moody (Greater Vancouver REALTORS) | $680,000 | Condos | -3.7% | -8.1% | 3.5% |
| Burnaby East (Greater Vancouver REALTORS) | $698,800 | Condos | -7.1% | -13.9% | -3.3% |
| Burnaby South (Greater Vancouver REALTORS) | $716,500 | Condos | -7.9% | -15.1% | -1.9% |
| North Vancouver (Greater Vancouver REALTORS) | $736,300 | Condos | -6.1% | -8.9% | 3.2% |
| Vancouver West (Greater Vancouver REALTORS) | $751,400 | Condos | -3.8% | -11.2% | -5.3% |
| West Vancouver (Greater Vancouver REALTORS) | $1,142,600 | Condos | 4.5% | -10.6% | -0.7% |
How We Modelled Home Equity by Purchase Year
Each purchase is the MLS Home Price Index benchmark of its month, the price of a typical home in that market, not an average sale. A purchase year is the average of its months, January to September for 2026, and every purchase is valued at the October 2026 benchmark. The benchmark describes a typical home in each market's housing stock, so it tracks home values rather than the mix of homes that sold. The main case is 20 per cent down with an uninsured mortgage at the Bank of Canada average rate on new 5-year-plus fixed loans for that month, a 25-year amortization, monthly payments and renewal at the then current rate after five years.
Equity gained is the value today minus the balance owed, minus the down payment: the price change plus the principal repaid. The minimum down payment case (5 per cent of the first $500,000 and 10 per cent of the rest) uses the insured rate, adds the CMHC premium to the loan and applies the insured price cap in force at purchase. Neither case includes closing costs, property transfer tax, selling costs, renovations, extra payments, refinancing or rental income from a suite, and the 30-year amortization now open to some insured buyers is not modelled, so real owners will differ.
Frequently Asked Questions
How much home equity have Canadian homeowners gained or lost since 2020, by city?
It depends on the purchase year. In our model, a Greater Vancouver buyer of a benchmark home in 2020 with 20% down has gained +$277,000 of equity by October 2026, from a price change of +14.5% plus principal repaid. A 2022 buyer is at -$13,000 and a 2024 buyer at -$70,000, because prices fell more than the mortgage was paid down. Across Canada, 2020 buyers gained the most in Quebec City and Halifax-Dartmouth on price. (Strawhomes equity model: CREA MLS Home Price Index and Bank of Canada mortgage rates, 2026)
Which purchase year lost the most home equity in the Canadian real estate market?
On price, 2022, the peak year. Benchmark price changes for 2022 buyers are -20.2% in the Fraser Valley, -19.8% in Greater Toronto, -19.1% in Hamilton-Burlington and -10.0% in Greater Vancouver, from CREA MLS Home Price Index data to October 2026. On modelled equity, Greater Vancouver's largest loss is the 2024 cohort, at -$70,000 with 20% down. (Strawhomes calculation from CREA MLS Home Price Index data, 2026)
Are Canadian homeowners underwater on their mortgages in 2026?
In our model, no 20%-down buyer of a benchmark home is underwater. With 20% down, the model shows negative equity gained in 30 of 98 market and purchase-year combinations since 2020, but equity is still positive in every one. At the minimum down payment the risk is real: 7 of 12 Greater Vancouver purchase months in 2025 leave modelled equity below zero. (Strawhomes equity model: CREA MLS Home Price Index and Bank of Canada mortgage rates, 2026)
Do homeowners have a higher net worth than renters in Canada, and does homeownership still pay?
Yes, by a wide margin. Statistics Canada puts average net worth at $1,407,787 per owner household and $355,473 per renter household in Q4 2025, 4.0 times as much. In Q4 2019 the ratio was 4.9 times. Averages are pulled up by the richest households, and owners are older on average. (Strawhomes calculation from Statistics Canada table 36-10-0660-01, 2026)
Which Metro Vancouver and Surrey areas have lost value since 2021?
25 of 28 Greater Vancouver and Fraser Valley board areas have a lower composite benchmark than in October 2021. North Surrey (-18.1%), Mission (-16.2%) and West Vancouver (-14.3%) fell most. Squamish, Vancouver East and Pitt Meadows are higher. (Fraser Valley Real Estate Board, October 2026 statistics package, 2026)
How is home equity calculated in this article?
Equity is the home's value minus the mortgage balance. Each owner is assumed to buy a home at the MLS Home Price Index benchmark of its month, valued today at the October 2026 benchmark, with 20% down, a 25-year amortization and the Bank of Canada average 5-year-plus fixed rate for that month, with renewal after five years. Closing and selling costs are left out. (Strawhomes equity model: CREA MLS Home Price Index and Bank of Canada mortgage rates, 2026)
Which province and which major Canadian cities lost the most home equity: Ontario or British Columbia?
Both lost ground for 2022 buyers. In British Columbia the Fraser Valley is at -20.2%, Greater Vancouver -10.0% and Victoria -4.3%. In Ontario, Greater Toronto is at -19.8%, Hamilton-Burlington -19.1% and Ottawa -4.2%. Alberta, the Prairies and Quebec are higher than in 2022, led by Quebec City at +40.8%. (Strawhomes calculation from CREA MLS Home Price Index data, 2026)
How have Bank of Canada interest rates and borrowing costs affected home equity and affordability since 2020?
Through the rate each buyer locked in. The average 5-year-plus fixed rate on new uninsured mortgages was 2.18% in 2021 and 5.40% in 2023, per Bank of Canada data. At the higher rate more of each payment goes to interest, so a 2023 Greater Vancouver buyer has repaid $64,000 of principal, while prices for that year are -8.6%. (Strawhomes calculation from Bank of Canada A4 mortgage rates, 2026)
Methodology
Prices: CREA MLS Home Price Index monthly benchmarks, not seasonally adjusted, January 2020 to October 2026, for the Greater Vancouver and Fraser Valley board areas, eleven other Canadian markets and the national composite, by composite and, for the two British Columbia boards, by home type. The other markets are Victoria, British Columbia; Calgary and Edmonton; Saskatoon and Winnipeg for the Canadian Prairies; Greater Toronto, Hamilton-Burlington and Ottawa; Montreal and Quebec City; and Halifax-Dartmouth, Nova Scotia, for Atlantic Canada. CREA also tracks smaller markets in Nova Scotia and New Brunswick, Regina, Saskatchewan, St. John's, Newfoundland and Labrador, and Windsor-Essex; they are left out to keep one major city per region. CREA's Greater Vancouver area is the Greater Vancouver REALTORS area; Surrey, Langley, White Rock and North Delta are in the Fraser Valley board. Board areas: the composite benchmark and the one-, three- and five-year changes printed in the Greater Vancouver REALTORS and Fraser Valley Real Estate Board October 2026 releases; the October 2021 price is backed out of the five-year change. Rates: Bank of Canada A4 monthly averages for new chartered-bank mortgages, fixed 5 years and over, uninsured and insured, to September 2026. Insurance: the CMHC premium table, CMHC's minimum down payment rules and the federal price cap change reported by CMHC. Net worth: Statistics Canada table 36-10-0660-01, average value per household by housing tenure, Q4 2019 to Q4 2025, the latest quarter published; it groups households by owner-occupancy (housing tenure) and does not separate multiple-property owners or an investor with several homes from other owners. Home purchases are modelled, not observed, and Canada’s housing data from these sources is national or regional, not by street. Our own MLS sales history starts in November 2024, too late for most purchase years, so it is not used here. Recency check: social and web search for the last 30 days; no newer public figure by purchase year was found.
Sources consulted: 64
Sources cited: 8
Data freshness: current year: 4, last year: 1, older: 3
Data range: MLS HPI benchmarks January 2020 to October 2026; mortgage rates January 2020 to September 2026; StatCan household wealth Q4 2019 to Q4 2025
Research date: 2026-11-18
Update schedule: Quarterly
Limitations: Equity is modelled for a buyer of the benchmark home, not measured for real households. The model leaves out closing costs, selling costs, renovations, extra mortgage payments, refinancing and variable-rate loans. Board sub-area figures cover October purchases only (2021, 2023, 2025). StatCan net worth is an average per household by tenure, Canada-wide, to Q4 2025.
Sources & References
- Canadian Real Estate Association. "MLS Home Price Index data download (November 2026 release, data to October 2026)." crea.ca/files/mls-hpi-data/MLS_HPI-Nov-2026.zip. Accessed 2026-11-18.
- Greater Vancouver REALTORS. "Monthly Market Report, October 2026." members.gvrealtors.ca/news/GVR-Stats-Package-October-2026.pdf. Accessed 2026-11-18.
- Fraser Valley Real Estate Board. "Monthly Statistics Package, October 2026." fvreb.bc.ca/statistics/Package202610.pdf. Accessed 2026-11-18.
- Bank of Canada. "Valet: interest rates on new residential mortgages, chartered banks (A4)." bankofcanada.ca/valet/observations/group/A4_RATES_MORTGAGES/json. Accessed 2026-11-18.
- Statistics Canada. "Distributions of household economic accounts, wealth, by characteristic, Canada, quarterly (table 36-10-0660-01)." www150.statcan.gc.ca/t1/wds/rest/getDataFromVectorByReferencePeriodRange?vectorI. Accessed 2026-11-18.
- CMHC. "CMHC mortgage loan insurance cost." cmhc-schl.gc.ca/consumers/home-buying/mortgage-loan-insurance-for-consumers/cmhc. Accessed 2026-11-18.
- CMHC. "What is mortgage loan insurance." cmhc-schl.gc.ca/consumers/home-buying/mortgage-loan-insurance-for-consumers/what. Accessed 2026-11-18.
- CMHC. "CMHC releases results for Q3 2024." cmhc-schl.gc.ca/media-newsroom/news-releases/2024/cmhc-releases-results-q3-2024. Accessed 2026-11-18.

Let's Chat! Looking for a REALTOR® who can exceed your expectations? Look no further than Richard Morrison! His mission is to serve without limit & provide solutions that cater to your core needs.
• 20+ Years of Experience
• Medallion Member
• RE/MAX Hall of Fame

Latest Properties Added
| Property | Size | Price | Date Listed |
|---|---|---|---|
| 617 - 4909 Elliott Street, Delta | 850 sqft | $819,900 | Nov 17, 2026 |
| 9558 168 Street, Surrey | 943 sqft | $1,980,000 | Nov 16, 2026 |
| 39 Eighth Avenue, New Westminster | 3,230 sqft | $1,500,000 | Nov 16, 2026 |
| 1 - 2333 54th Avenue, Vancouver | 1,641 sqft | $1,298,000 | Nov 17, 2026 |
| 6842 131 Street, Surrey | 3,892 sqft | $1,449,999 | Nov 13, 2026 |
| 14 - 13640 84 Avenue, Surrey | 1,257 sqft | $585,000 | Nov 16, 2026 |
| 7740 Ash Street, Richmond | 2,593 sqft | $1,698,000 | Nov 17, 2026 |
| 2463 Rabbit Drive, Tsawwassen | 551 sqft | $443,900 | Nov 18, 2026 |
| PH 601 - 1100 Clarke Road, Port Moody | 1,153 sqft | $1,020,000 | Nov 17, 2026 |
| 805 - 7979 Firbridge Way, Richmond | 905 sqft | $629,000 | Nov 16, 2026 |
| 1220 - 68 Smithe Street, Vancouver | 722 sqft | $699,000 | Nov 18, 2026 |
| 2308 Edinburgh Street, New Westminster | 1,438 sqft | $829,000 | Nov 17, 2026 |
Start your search with Richard Morrison, Top Award Winning Vancouver Realtor
Contact Richard Morrison Top Vancouver Realtor today to find a Vancouver houses for sale and Vancouver condos for sale. Also check out Burnaby houses for sale or maybe Burnaby condos for sale. If you prefer North Shore, take a look at our listings in North Vancouver houses for sale and North Vancouver condos for sale.