Metro Vancouver and Fraser Valley Home Prices vs the 2022 Peak, by City and Type (2026)
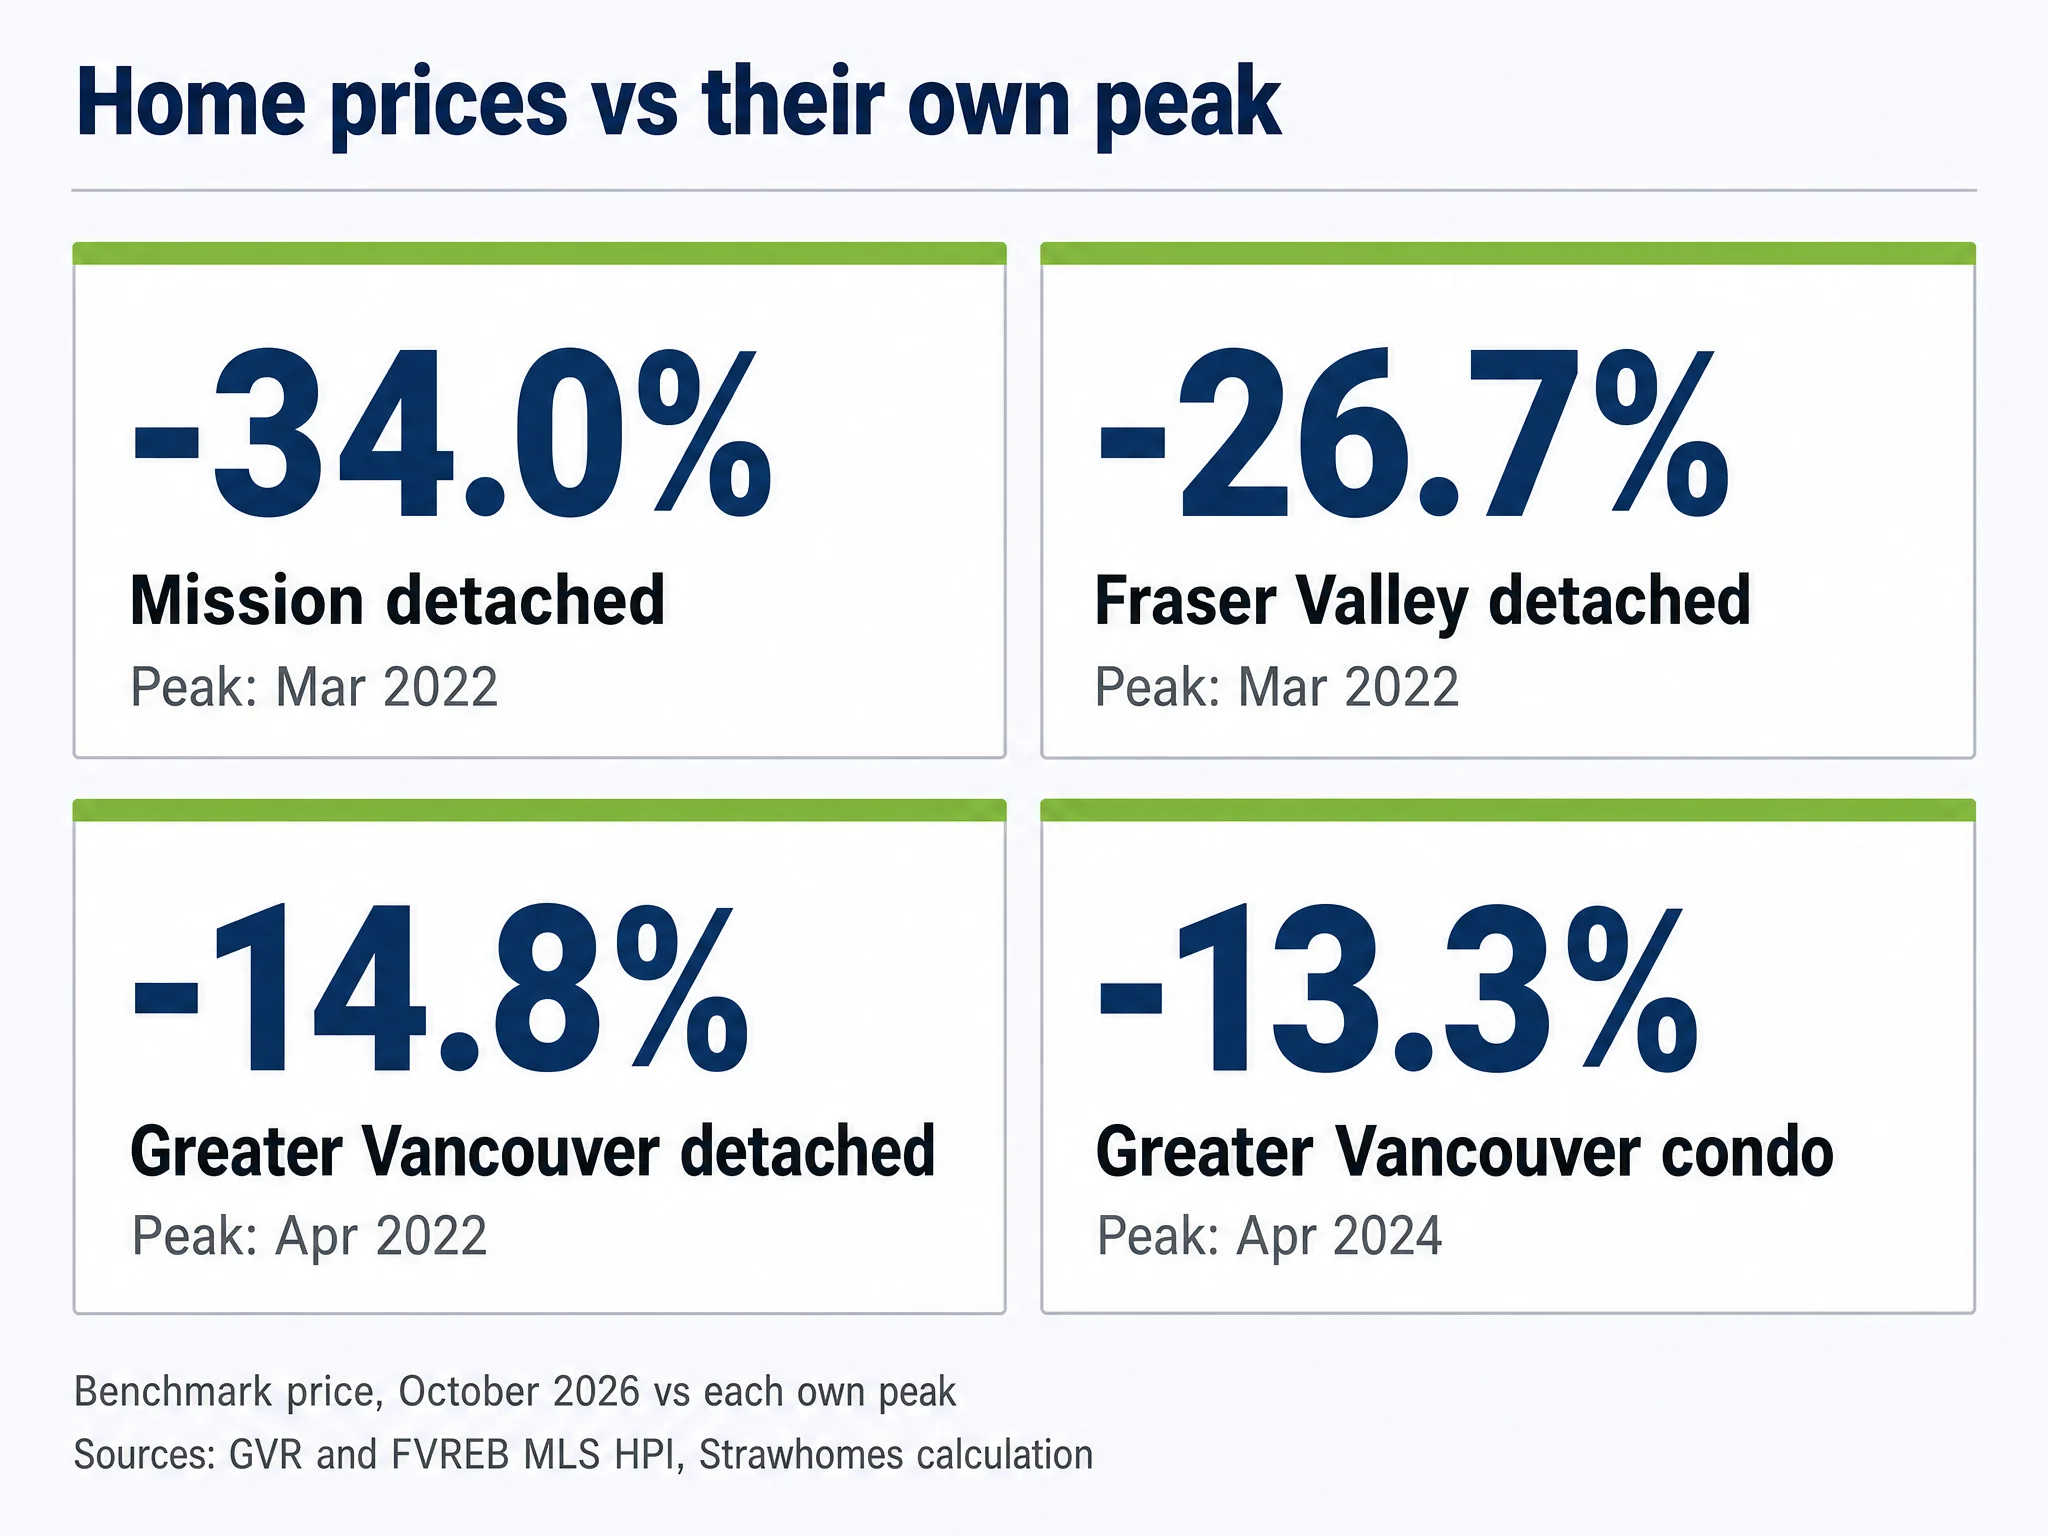
-34.0%: The Mission detached benchmark price is 34.0% below its March 2022 peak ($1,337,400 to $883,300 in October 2026), the deepest drop of the 90 southwest BC markets measured from their own peak on one consistent MLS HPI series. Source: Strawhomes calculation from Fraser Valley Real Estate Board MLS HPI releases (2026)
Key Takeaways
- 68 of 90 southwest BC city and home-type markets set their benchmark price peak in 2022; the other 22 peaked later, mostly in 2024. (Strawhomes calculation from GVR and FVREB MLS HPI releases, 2026)
- 14.8% is how far the Greater Vancouver detached benchmark sits below its April 2022 peak ($2,084,400 to $1,775,200). (Strawhomes calculation from Greater Vancouver REALTORS MLS HPI releases, 2026)
- 26.7% is the Fraser Valley detached drop from its March 2022 peak ($1,765,900 to $1,293,800), close to double Greater Vancouver's. (Strawhomes calculation from Fraser Valley Real Estate Board MLS HPI releases, 2026)
- 13.3% is the Greater Vancouver condo drop, measured from April 2024, not 2022: the condo benchmark set a second, slightly higher peak two years later. (Strawhomes calculation from Greater Vancouver REALTORS MLS HPI releases, 2026)
- 29 of 90 markets are at least 30% below their peak after Vancouver inflation; even the smallest real-terms drop is 11.7%. (Strawhomes calculation from GVR and FVREB MLS HPI releases, 2026)
- 26 of 26 city and type pairs saw both Strawhomes MLS sold medians and the benchmark fall from late 2024 to fall 2026; the median change was -12.8% for sold medians against -10.4% for the benchmark. (Strawhomes MLS sold data, 2026)
Mission detached houses are 34.0% below their March 2022 peak, the deepest drop of the 90 Metro Vancouver and Fraser Valley markets in this table (Strawhomes calculation from Fraser Valley Real Estate Board MLS HPI releases, 2026). Squamish detached sits at the other end, only 6.1% below its own peak. In between are every board sub-area and home type the Greater Vancouver and Fraser Valley boards benchmark across Metro Vancouver, from Sea-to-Sky and the Sunshine Coast to Chilliwack, each measured from its own peak month rather than from one regional date. The story of Vancouver house prices since 2022 depends on where you look and what you own.
That last point matters. The usual headline compares today's price with spring 2022, but 22 of 90 markets peaked later, mostly in 2024, and Greater Vancouver condos are 13.3% below an April 2024 peak, not a 2022 one (Greater Vancouver REALTORS MLS HPI, October 2026, 2026). In 24 of 90 markets a second high came within 1% of the first, so both months are shown. We also show the same drop after inflation, because a benchmark that is flat in dollars has still lost ground against Vancouver's cost of living (Statistics Canada, Table 18-10-0004-01, 2026).
Every figure comes from one consistent series: the boards' MLS Home Price Index (HPI) benchmark on its current vintage, chain-linked month by month. For housing market trends, sales and listings in each part of Vancouver's housing market, see the real estate market stats by city.
Which Metro Vancouver and Fraser Valley Markets Have Fallen Furthest From Their Peak?
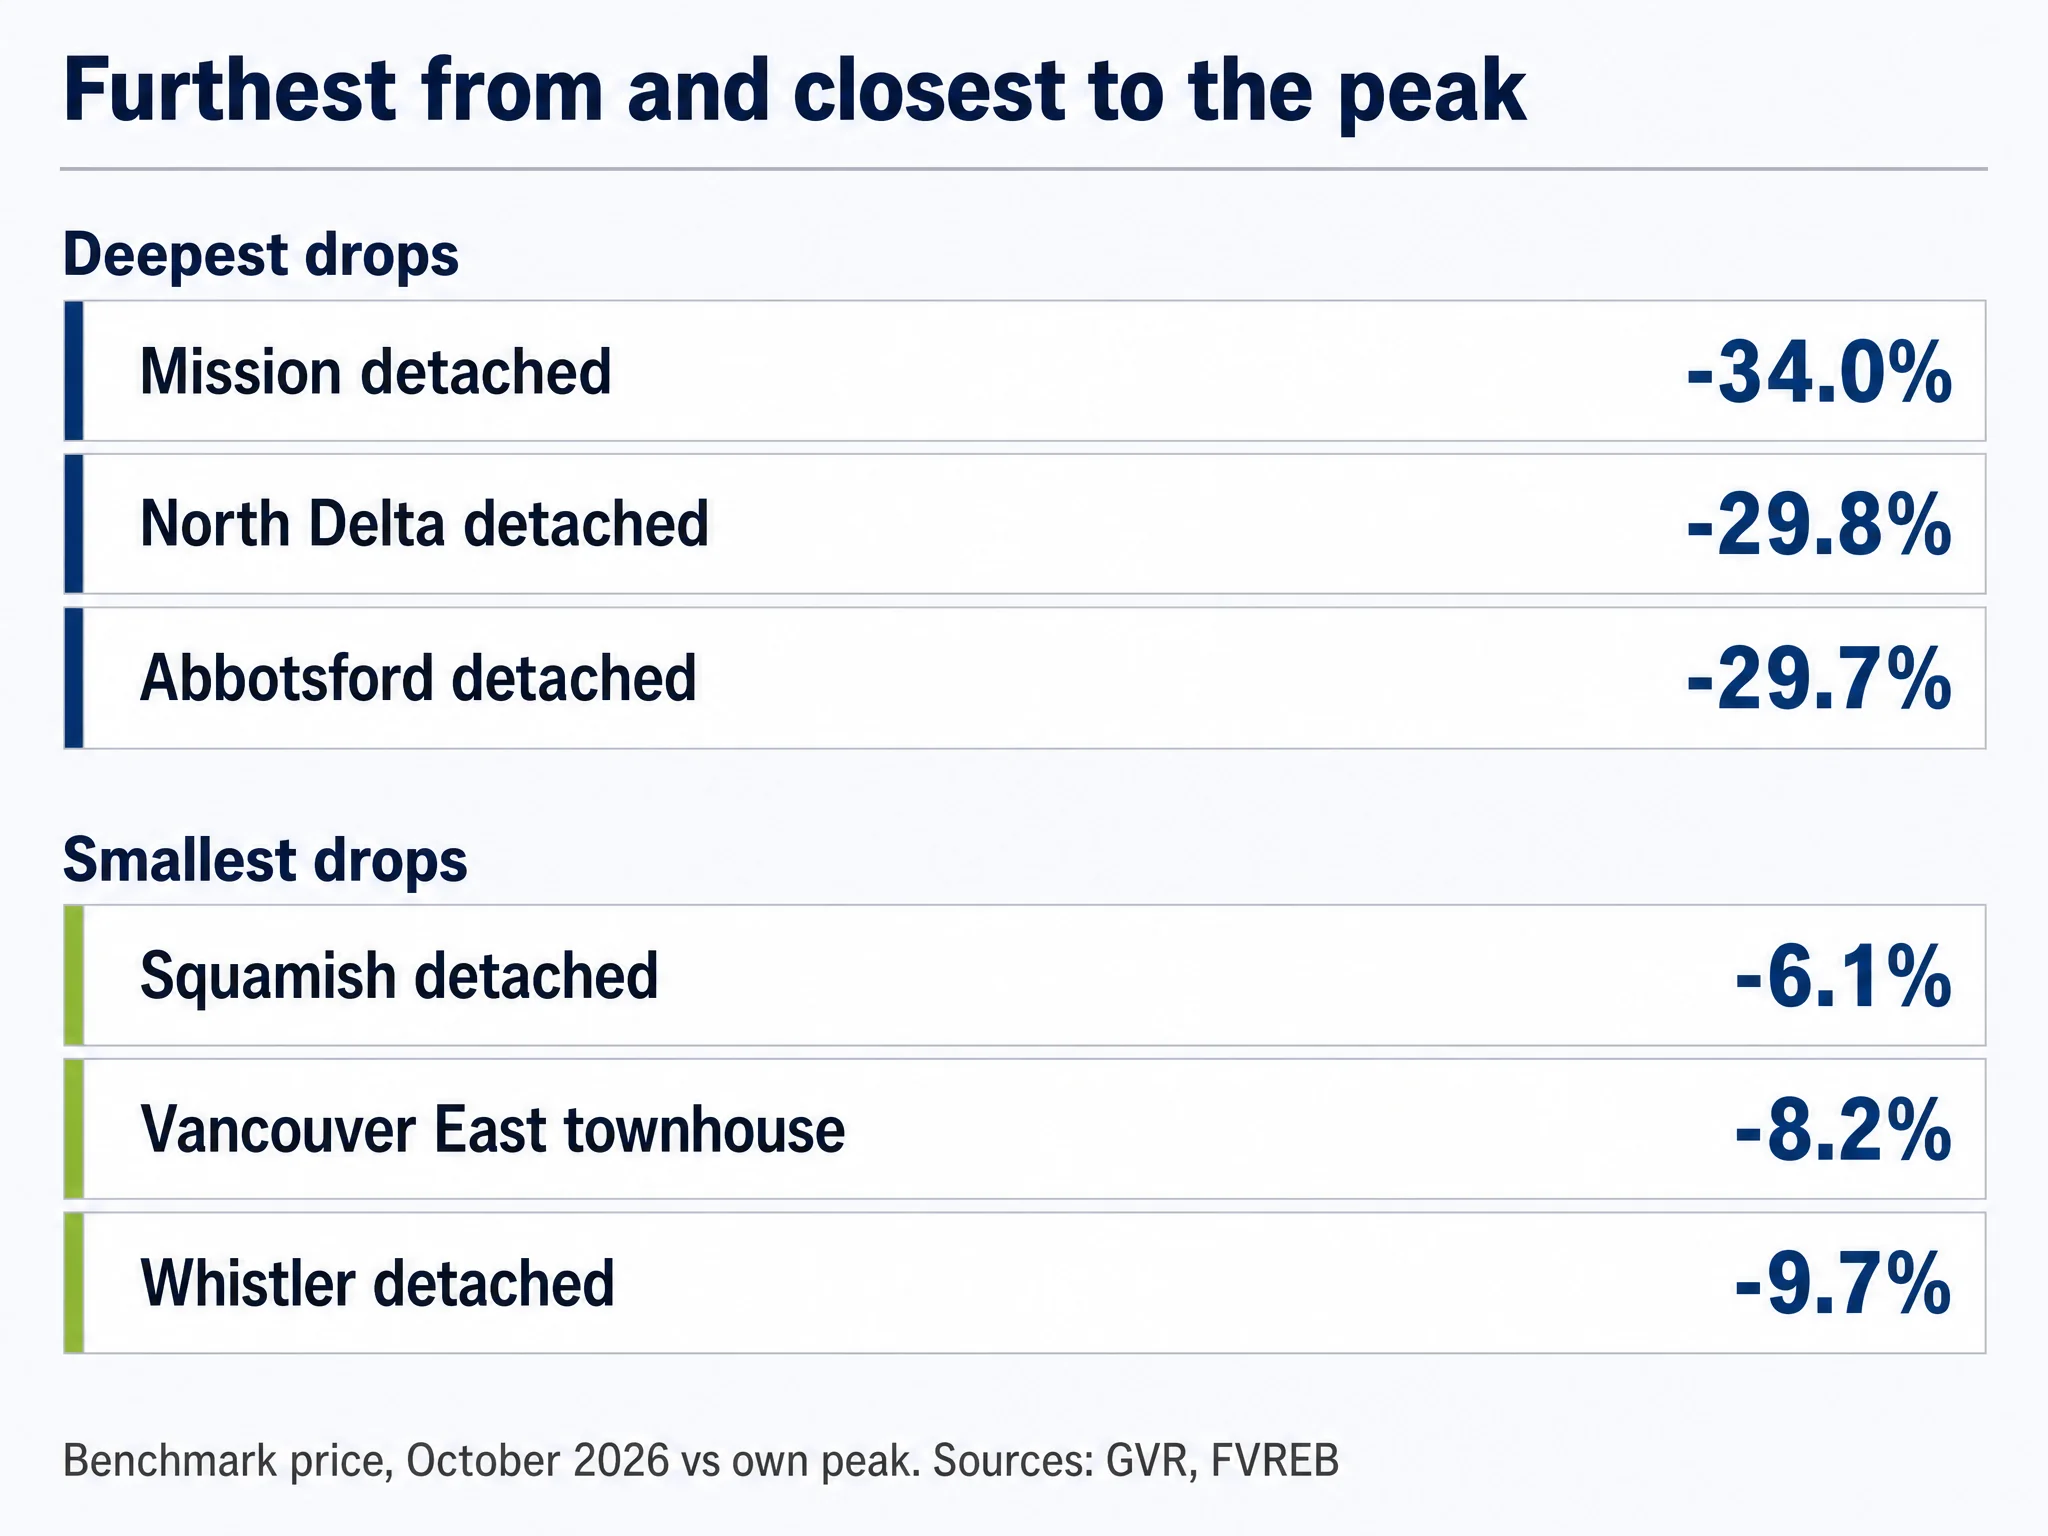
The Fraser Valley leads the declines. Mission detached is 34.0% below its March 2022 peak, North Delta detached 29.8% and Abbotsford detached 29.7% (Strawhomes calculation from Fraser Valley Real Estate Board MLS HPI releases, 2026). 30 of 90 markets are at least 20% below their own peak, and every one of them peaked in 2022.
| Market | Type | Peak month | Peak benchmark | Latest benchmark | Change from peak | After inflation | Source |
|---|---|---|---|---|---|---|---|
| Mission | Detached | Mar 2022 | $1,337,400 | $883,300 | -34.0% | -42.5% | FVREB MLS HPI, October 2026 |
| North Delta | Detached | Mar 2022 | $1,661,300 | $1,165,900 | -29.8% | -38.9% | FVREB MLS HPI, October 2026 |
| Abbotsford | Detached | Mar 2022 | $1,551,300 | $1,090,500 | -29.7% | -38.8% | FVREB MLS HPI, October 2026 |
| North Surrey | Detached | Apr 2022 | $1,758,300 | $1,254,500 | -28.7% | -37.2% | FVREB MLS HPI, October 2026 |
| Surrey | Detached | Mar 2022 | $1,793,100 | $1,288,000 | -28.2% | -37.4% | FVREB MLS HPI, October 2026 |
| North Surrey | Condo | Apr 2022 | $535,200 | $392,300 | -26.7% | -35.5% | FVREB MLS HPI, October 2026 |
| North Delta | Condo | Apr 2022 | $645,700 | $475,700 | -26.3% | -35.2% | FVREB MLS HPI, October 2026 |
| Sunshine Coast | Condo | Jun 2022 | $626,700 | $462,300 | -26.2% | -34.2% | GVR MLS HPI, October 2026 |
| Cloverdale | Detached | Mar 2022 | $1,781,500 | $1,326,400 | -25.5% | -35.1% | FVREB MLS HPI, October 2026 |
| South Surrey and White Rock | Townhouse | Mar 2022 | $1,060,300 | $800,900 | -24.5% | -34.2% | FVREB MLS HPI, October 2026 |
| Surrey | Condo | Apr 2022 | $600,300 | $453,600 | -24.4% | -33.5% | FVREB MLS HPI, October 2026 |
| Maple Ridge | Townhouse | Mar 2022 | $905,600 | $686,600 | -24.2% | -34.0% | GVR MLS HPI, October 2026 |
-42.5%: Mission detached after Vancouver inflation: the benchmark has lost more than four dollars in ten of purchasing power since March 2022. (Strawhomes calculation from Fraser Valley Real Estate Board MLS HPI releases and Statistics Canada CPI, 2026)
- Vancouver West: $603,000
- West Vancouver: $600,000
- South Surrey and White Rock: $512,500
- Surrey: $505,100
- North Surrey: $503,800
- North Delta: $495,400
- Abbotsford: $460,800
- Cloverdale: $455,100
The pattern is geographic before it is about home type. Ten of the twelve deepest drops are in the Fraser Valley board area, and detached houses take five of the top six places. Surrey detached is 28.2% below March 2022 and North Surrey detached 28.7%, a fall of $503,800 on the benchmark home (Strawhomes calculation from Fraser Valley Real Estate Board MLS HPI releases, 2026).
In dollars the ranking changes. West Vancouver detached is only 17.3% below its June 2022 peak, yet that is $600,000 off the benchmark home, and Vancouver West detached is down $603,000 (Strawhomes calculation from Greater Vancouver REALTORS MLS HPI releases, 2026). A buyer who stretched for an expensive house in 2022 can be further underwater in dollars than a Mission buyer who took the bigger percentage hit on the investment, because higher prices turn the same percentage into more dollars. Whether that loss is real depends on market value, not the assessed value printed on a tax notice, and a lender's real estate appraisal tests it at resale.
Inflation makes every one of these drops deeper. Vancouver's consumer price index rose from 145.3 in March 2022 and 146.7 in April 2022 to 166.8 in September 2026, so a benchmark that is flat in dollars has lost real value against higher housing costs and everything else. After inflation, the Greater Vancouver detached benchmark is 25.1% below April 2022, Langley detached 32.7% below March 2022 and Abbotsford detached 38.8% (Strawhomes calculation from Fraser Valley Real Estate Board MLS HPI releases and Statistics Canada CPI, 2026). In total 29 of 90 markets are at least 30% below their peak in real terms (Strawhomes calculation from GVR and FVREB MLS HPI releases, 2026), and not one is within 10% of it.
Fraser Valley Home Prices: How Far Below the 2022 Peak Is Each City?
Further than Greater Vancouver, for every home type. The Fraser Valley board's detached benchmark is 26.7% below March 2022, townhouses 20.1% and condos 20.4% below April 2022 (Strawhomes calculation from Fraser Valley Real Estate Board MLS HPI releases, 2026). 24 of 24 sub-area markets in Surrey, North Delta, Langley, Abbotsford and Mission peaked in 2022.
| Market | Type | Peak month | Peak benchmark | Latest benchmark | Change from peak | After inflation | Source |
|---|---|---|---|---|---|---|---|
| Fraser Valley (board) | Detached | Mar 2022 | $1,765,900 | $1,293,800 | -26.7% | -36.2% | FVREB MLS HPI, October 2026 |
| Fraser Valley (board) | Townhouse | Apr 2022 | $929,000 | $742,300 | -20.1% | -29.7% | FVREB MLS HPI, October 2026 |
| Fraser Valley (board) | Condo | Apr 2022 | $579,200 | $460,800 | -20.4% | -30.0% | FVREB MLS HPI, October 2026 |
| North Delta | Detached | Mar 2022 | $1,661,300 | $1,165,900 | -29.8% | -38.9% | FVREB MLS HPI, October 2026 |
| North Delta | Townhouse | Mar 2022 | $1,086,100 | $867,500 | -20.1% | -30.4% | FVREB MLS HPI, October 2026 |
| North Delta | Condo | Apr 2022 | $645,700 | $475,700 | -26.3% | -35.2% | FVREB MLS HPI, October 2026 |
| North Surrey | Detached | Apr 2022 | $1,758,300 | $1,254,500 | -28.7% | -37.2% | FVREB MLS HPI, October 2026 |
| North Surrey | Townhouse | Mar 2022 | $856,300 | $671,000 | -21.6% | -31.7% | FVREB MLS HPI, October 2026 |
| North Surrey | Condo | Apr 2022 | $535,200 | $392,300 | -26.7% | -35.5% | FVREB MLS HPI, October 2026 |
| Surrey | Detached | Mar 2022 | $1,793,100 | $1,288,000 | -28.2% | -37.4% | FVREB MLS HPI, October 2026 |
| Surrey | Townhouse | Mar 2022 | $961,100 | $744,300 | -22.6% | -32.5% | FVREB MLS HPI, October 2026 |
| Surrey | Condo | Apr 2022 | $600,300 | $453,600 | -24.4% | -33.5% | FVREB MLS HPI, October 2026 |
| Cloverdale | Detached | Mar 2022 | $1,781,500 | $1,326,400 | -25.5% | -35.1% | FVREB MLS HPI, October 2026 |
| Cloverdale | Townhouse | Mar 2022 | $960,400 | $757,900 | -21.1% | -31.3% | FVREB MLS HPI, October 2026 |
| Cloverdale | Condo | Apr 2022 | $630,500 | $501,800 | -20.4% | -30.0% | FVREB MLS HPI, October 2026 |
| South Surrey and White Rock | Detached | Apr 2022 | $2,119,000 | $1,606,500 | -24.2% | -33.3% | FVREB MLS HPI, October 2026 |
| South Surrey and White Rock | Townhouse | Mar 2022 | $1,060,300 | $800,900 | -24.5% | -34.2% | FVREB MLS HPI, October 2026 |
| South Surrey and White Rock | Condo | Mar 2022 | $649,100 | $558,600 | -13.9% | -25.0% | FVREB MLS HPI, October 2026 |
| Langley | Detached | Mar 2022 | $1,875,400 | $1,448,100 | -22.8% | -32.7% | FVREB MLS HPI, October 2026 |
| Langley | Townhouse | May 2022 | $946,500 | $800,600 | -15.4% | -24.7% | FVREB MLS HPI, October 2026 |
| Langley | Condo | Apr 2022 | $639,200 | $522,300 | -18.3% | -28.1% | FVREB MLS HPI, October 2026 |
| Abbotsford | Detached | Mar 2022 | $1,551,300 | $1,090,500 | -29.7% | -38.8% | FVREB MLS HPI, October 2026 |
| Abbotsford | Townhouse | Jun 2022 | $765,000 | $579,600 | -24.2% | -32.4% | FVREB MLS HPI, October 2026 |
| Abbotsford | Condo | Apr 2022 | $482,900 | $370,300 | -23.3% | -32.6% | FVREB MLS HPI, October 2026 |
| Mission | Detached | Mar 2022 | $1,337,400 | $883,300 | -34.0% | -42.5% | FVREB MLS HPI, October 2026 |
| Mission | Townhouse | May 2022 | $730,100 | $606,100 | -17.0% | -26.1% | FVREB MLS HPI, October 2026 |
| Mission | Condo | Jun 2022 | $497,300 | $396,200 | -20.3% | -28.9% | FVREB MLS HPI, October 2026 |
| Chilliwack and District (board) | Detached | Feb 2022 | $1,125,200 | $861,300 | -23.5% | -34.4% | CREA MLS HPI data, September 2026 |
| Chilliwack and District (board) | Townhouse | Feb 2022 | $710,400 | $580,600 | -18.3% | -30.0% | CREA MLS HPI data, September 2026 |
| Chilliwack and District (board) | Condo | May 2022 | $453,800 | $387,700 | -14.6% | -23.9% | CREA MLS HPI data, September 2026 |
-26.7%: Fraser Valley board detached benchmark against its March 2022 peak, October 2026. (Strawhomes calculation from Fraser Valley Real Estate Board MLS HPI releases, 2026)
The Fraser Valley turned first, in early 2022, after the run-up of the COVID-19 pandemic years. The Chilliwack and District detached and townhouse benchmarks peaked in February 2022 and the Fraser Valley detached benchmark in March 2022 (Strawhomes calculation from Fraser Valley Real Estate Board MLS HPI releases, 2022), while much of Burnaby and Richmond kept rising for two more years. The median Fraser Valley sub-area is 28.4% below its peak for detached houses, 21.4% for townhouses and 21.9% for condos (Strawhomes calculation from GVR and FVREB MLS HPI releases, 2026). Our Surrey market report tracks the same slide in monthly sales.
Langley has the smallest detached drop in the Fraser Valley. Langley detached is 22.8% below March 2022, a drop from $1,875,400 to $1,448,100, and South Surrey and White Rock has the smallest condo drop, 13.9% below March 2022 (Strawhomes calculation from Fraser Valley Real Estate Board MLS HPI releases, 2026). The Chilliwack and District board's detached benchmark is 23.5% below February 2022 (CREA MLS HPI data, September 2026, 2026).
Townhouses, or townhomes as the Fraser Valley board calls them, are no refuge here. Surrey townhouses are 22.6% below March 2022 and Abbotsford 24.2% below June 2022 (Strawhomes calculation from Fraser Valley Real Estate Board MLS HPI releases, 2026). Bigger drops mean more volatility for owners here. These are the markets that rose fastest into 2022, and our article on how rising interest rates affect the housing market explains why rate rises weigh on prices.
Board-wide average prices tell the same story more loudly. The Fraser Valley board's average detached sale was $1,898,693 in February 2022 and $1,308,329 in October 2026, a change of -31.1% (Fraser Valley Real Estate Board, February 2022, 2022). Average townhouse prices changed by -24.3% and average apartment prices by -24.0% over the same months (Fraser Valley Real Estate Board, October 2026, 2026). Averages move with the mix of homes that happen to sell, so they can overstate the change in a typical home's value, which is why we measure the peak on the benchmark instead.
When Did Vancouver House Prices Last Peak? Greater Vancouver Detached Houses by Neighbourhood
The median Greater Vancouver sub-area detached market is 17.2% below its own peak (Strawhomes calculation from GVR and FVREB MLS HPI releases, 2026), and the board's detached benchmark is 14.8% below April 2022. Six sub-areas, all in Burnaby, Richmond, New Westminster and Port Moody, peaked later, in 2024.
| Market | Peak month | Peak benchmark | Latest benchmark | Change from peak | After inflation | Next-highest month | Its level vs peak | Source |
|---|---|---|---|---|---|---|---|---|
| Maple Ridge | Mar 2022 | $1,479,000 | $1,138,500 | -23.0% | -32.9% | Jul 2024 | -11.5% | GVR MLS HPI, October 2026 |
| Pitt Meadows | Mar 2022 | $1,509,800 | $1,172,600 | -22.3% | -32.3% | Jul 2023 | -10.9% | GVR MLS HPI, October 2026 |
| Port Coquitlam | Mar 2022 | $1,551,600 | $1,235,900 | -20.3% | -30.6% | Oct 2024 | -6.4% | GVR MLS HPI, October 2026 |
| Bowen Island | May 2022 | $1,740,400 | $1,398,200 | -19.7% | -28.5% | Jun 2024 | -9.6% | GVR MLS HPI, October 2026 |
| Coquitlam | Apr 2022 | $1,924,900 | $1,571,400 | -18.4% | -28.2% | May 2024 | -4.9% | GVR MLS HPI, October 2026 |
| New Westminster | May 2024 | $1,650,800 | $1,347,700 | -18.4% | -22.4% | Mar 2022 | -0.1% | GVR MLS HPI, October 2026 |
| Sunshine Coast | May 2022 | $1,041,300 | $850,200 | -18.4% | -27.3% | Nov 2024 | -10.4% | GVR MLS HPI, October 2026 |
| Richmond | Aug 2024 | $2,222,500 | $1,833,100 | -17.5% | -21.3% | Apr 2022 | -0.3% | GVR MLS HPI, October 2026 |
| West Vancouver | Jun 2022 | $3,464,900 | $2,864,900 | -17.3% | -26.2% | Aug 2024 | -2.7% | GVR MLS HPI, October 2026 |
| Vancouver East | May 2022 | $1,945,800 | $1,610,700 | -17.2% | -26.3% | Aug 2023 | -1.8% | GVR MLS HPI, October 2026 |
| Vancouver West | Apr 2022 | $3,502,700 | $2,899,700 | -17.2% | -27.2% | Jun 2024 | -0.1% | GVR MLS HPI, October 2026 |
| Burnaby South | May 2024 | $2,292,000 | $1,904,400 | -16.9% | -21.0% | Apr 2022 | -1.6% | GVR MLS HPI, October 2026 |
| Ladner | Mar 2022 | $1,518,000 | $1,262,500 | -16.8% | -27.6% | Sep 2024 | -5.3% | GVR MLS HPI, October 2026 |
| Burnaby North | Jun 2024 | $2,132,100 | $1,795,200 | -15.8% | -20.1% | Apr 2025 | -0.3% | GVR MLS HPI, October 2026 |
| Tsawwassen | May 2022 | $1,743,100 | $1,469,500 | -15.7% | -24.9% | Apr 2024 | -4.1% | GVR MLS HPI, October 2026 |
| Burnaby East | Aug 2024 | $1,987,000 | $1,681,600 | -15.4% | -19.3% | Mar 2025 | -0.6% | GVR MLS HPI, October 2026 |
| Port Moody | Sep 2024 | $2,204,200 | $1,868,000 | -15.3% | -19.3% | May 2022 | -0.6% | GVR MLS HPI, October 2026 |
| Greater Vancouver (board) | Apr 2022 | $2,084,400 | $1,775,200 | -14.8% | -25.1% | May 2024 | -1.6% | GVR MLS HPI, October 2026 |
| North Vancouver | Mar 2022 | $2,372,800 | $2,058,800 | -13.2% | -24.4% | Jun 2024 | -3.4% | GVR MLS HPI, October 2026 |
| Whistler | Jul 2022 | $2,930,700 | $2,646,200 | -9.7% | -19.0% | Feb 2026 | -3.0% | GVR MLS HPI, October 2026 |
| Squamish | Jun 2022 | $1,790,100 | $1,681,800 | -6.1% | -16.2% | Feb 2026 | -1.2% | GVR MLS HPI, October 2026 |
-14.8%: Greater Vancouver detached benchmark against its April 2022 peak, October 2026. (Strawhomes calculation from Greater Vancouver REALTORS MLS HPI releases, 2026)
Greater Vancouver's detached market splits in two. Fraser Valley-adjacent areas such as Maple Ridge (down 23.0%), Pitt Meadows (down 22.3%) and Port Coquitlam (down 20.3%) fell hard from March 2022 (Strawhomes calculation from Greater Vancouver REALTORS MLS HPI releases, 2026). Burnaby, Richmond, New Westminster and Port Moody detached kept climbing and set their highs in 2024, so their drops are measured from a later and higher point: Richmond detached is 17.5% below August 2024.
Detached prices fell fast once prices peaked. By December 2022 the Greater Vancouver detached benchmark was already 13.2% below April 2022, then prices rose through 2023 to within 4.0% of the peak before falling again (Strawhomes calculation from GVR and FVREB MLS HPI releases, 2022). Today the benchmark price for a detached home in Greater Vancouver is $1,775,200, and the composite benchmark price in Greater Vancouver, all home types together, is $1,068,600 (Greater Vancouver REALTORS MLS HPI, October 2026, 2026).
For those late peaks the choice of month barely matters. Burnaby South detached peaked in May 2024 and is 16.9% below it (Strawhomes calculation from Greater Vancouver REALTORS MLS HPI releases, 2026); its April 2022 level sat at -1.6% against that peak. East Vancouver detached, the board's Vancouver East, is 17.2% below May 2022, North Vancouver detached is 13.2% below March 2022 and Coquitlam detached 18.4% below April 2022 (Strawhomes calculation from Greater Vancouver REALTORS MLS HPI releases, 2026).
The resort and Sea-to-Sky markets held up best. Squamish detached is 6.1% below June 2022 and Whistler detached 9.7% below July 2022 (Strawhomes calculation from Greater Vancouver REALTORS MLS HPI releases, 2026). If you are weighing a house against attached living, our guide to choosing a townhouse or a detached home covers the trade-offs that the price gap does not.
Greater Vancouver Townhouses: Which Property Type Peaked Latest?
Greater Vancouver townhouses fell least of the three types. The median sub-area townhouse market is 13.8% below its own peak (Strawhomes calculation from GVR and FVREB MLS HPI releases, 2026), and the board's townhouse benchmark is 12.1% below April 2022. Nine townhouse markets set their peak in 2024 or 2025.
| Market | Peak month | Peak benchmark | Latest benchmark | Change from peak | After inflation | Next-highest month | Its level vs peak | Source |
|---|---|---|---|---|---|---|---|---|
| Maple Ridge | Mar 2022 | $905,600 | $686,600 | -24.2% | -34.0% | Mar 2025 | -11.9% | GVR MLS HPI, October 2026 |
| Port Moody | May 2022 | $1,111,200 | $895,800 | -19.4% | -28.2% | Aug 2023 | -6.5% | GVR MLS HPI, October 2026 |
| Pitt Meadows | May 2022 | $903,600 | $731,800 | -19.0% | -27.9% | Apr 2024 | -5.8% | GVR MLS HPI, October 2026 |
| Tsawwassen | Mar 2022 | $1,057,200 | $878,400 | -16.9% | -27.6% | Mar 2024 | -1.9% | GVR MLS HPI, October 2026 |
| Port Coquitlam | Apr 2022 | $1,021,600 | $854,900 | -16.3% | -26.4% | Jul 2023 | -5.4% | GVR MLS HPI, October 2026 |
| Coquitlam | Apr 2022 | $1,140,500 | $962,600 | -15.6% | -25.8% | May 2024 | -4.4% | GVR MLS HPI, October 2026 |
| Vancouver West | Dec 2024 | $1,523,200 | $1,285,000 | -15.6% | -19.2% | Apr 2022 | -2.2% | GVR MLS HPI, October 2026 |
| North Vancouver | May 2024 | $1,429,900 | $1,221,100 | -14.6% | -18.8% | Mar 2022 | -0.8% | GVR MLS HPI, October 2026 |
| Richmond | May 2024 | $1,175,100 | $1,009,300 | -14.1% | -18.4% | Jul 2023 | -1.6% | GVR MLS HPI, October 2026 |
| Ladner | May 2025 | $1,049,700 | $909,300 | -13.4% | -15.8% | Mar 2024 | -0.5% | GVR MLS HPI, October 2026 |
| Burnaby South | Jun 2024 | $1,060,100 | $922,900 | -12.9% | -17.4% | May 2022 | -0.4% | GVR MLS HPI, October 2026 |
| Greater Vancouver (board) | Apr 2022 | $1,145,300 | $1,006,500 | -12.1% | -22.7% | May 2024 | -0.3% | GVR MLS HPI, October 2026 |
| Whistler | May 2024 | $1,841,000 | $1,621,200 | -11.9% | -16.3% | Mar 2022 | -2.0% | GVR MLS HPI, October 2026 |
| Burnaby East | Jul 2024 | $946,400 | $839,300 | -11.3% | -15.4% | Apr 2025 | -2.6% | GVR MLS HPI, October 2026 |
| Burnaby North | May 2022 | $981,600 | $873,000 | -11.1% | -20.8% | Jun 2024 | -1.9% | GVR MLS HPI, October 2026 |
| New Westminster | May 2022 | $958,200 | $852,000 | -11.1% | -20.8% | Sep 2023 | -0.0% | GVR MLS HPI, October 2026 |
| Sunshine Coast | May 2024 | $797,300 | $708,600 | -11.1% | -15.5% | Mar 2022 | -2.2% | GVR MLS HPI, October 2026 |
| Squamish | Mar 2022 | $1,075,100 | $968,600 | -9.9% | -21.5% | May 2024 | -0.8% | GVR MLS HPI, October 2026 |
| Vancouver East | Mar 2025 | $1,149,700 | $1,055,800 | -8.2% | -11.7% | Mar 2022 | -0.2% | GVR MLS HPI, October 2026 |
-8.2%: Vancouver East townhouses, measured from a March 2025 peak: the smallest townhouse drop in the region. (Strawhomes calculation from Greater Vancouver REALTORS MLS HPI releases, 2026)
Nine is more than for any other home type. Vancouver East townhouses peaked in March 2025 and are only 8.2% below it, while Vancouver West townhouses peaked in December 2024 and are 15.6% below (Strawhomes calculation from Greater Vancouver REALTORS MLS HPI releases, 2026). Ladner townhouses peaked as late as May 2025.
The 2022 peak still rules the edges. Maple Ridge townhouses are 24.2% below March 2022, the deepest townhouse drop on the Greater Vancouver side, and Port Moody townhouses 19.4% below May 2022 (Strawhomes calculation from Greater Vancouver REALTORS MLS HPI releases, 2026).
Greater Vancouver Condo Prices: Which Cities Peaked in 2022 and Which in 2024?
The median Greater Vancouver sub-area condo market is 15.5% below its own peak (Strawhomes calculation from GVR and FVREB MLS HPI releases, 2026). The board's condo benchmark peaked again in April 2024 and is 13.3% below that level, with May 2022 at -0.2% against it, a near tie.
| Market | Peak month | Peak benchmark | Latest benchmark | Change from peak | After inflation | Next-highest month | Its level vs peak | Source |
|---|---|---|---|---|---|---|---|---|
| Sunshine Coast | Jun 2022 | $626,700 | $462,300 | -26.2% | -34.2% | Nov 2023 | -7.6% | GVR MLS HPI, October 2026 |
| Whistler | Jun 2022 | $785,400 | $612,500 | -22.0% | -30.4% | Nov 2023 | -1.6% | GVR MLS HPI, October 2026 |
| Maple Ridge | May 2022 | $600,000 | $481,600 | -19.7% | -28.5% | Oct 2024 | -2.2% | GVR MLS HPI, October 2026 |
| Pitt Meadows | Apr 2022 | $644,700 | $523,500 | -18.8% | -28.6% | Oct 2024 | -0.5% | GVR MLS HPI, October 2026 |
| Richmond | May 2024 | $761,700 | $625,700 | -17.9% | -21.9% | Oct 2023 | -1.3% | GVR MLS HPI, October 2026 |
| Coquitlam | Apr 2022 | $756,700 | $624,200 | -17.5% | -27.4% | Apr 2024 | -0.7% | GVR MLS HPI, October 2026 |
| Tsawwassen | May 2022 | $710,100 | $588,800 | -17.1% | -26.2% | Jun 2024 | -0.8% | GVR MLS HPI, October 2026 |
| Ladner | May 2022 | $741,600 | $620,000 | -16.4% | -25.6% | Sep 2023 | -1.0% | GVR MLS HPI, October 2026 |
| Burnaby East | Apr 2022 | $829,900 | $698,800 | -15.8% | -25.9% | Apr 2024 | -1.9% | GVR MLS HPI, October 2026 |
| New Westminster | Sep 2024 | $669,700 | $565,900 | -15.5% | -19.5% | Sep 2023 | -1.0% | GVR MLS HPI, October 2026 |
| Burnaby South | Sep 2023 | $845,700 | $716,500 | -15.3% | -20.6% | Apr 2024 | -0.5% | GVR MLS HPI, October 2026 |
| Port Coquitlam | Apr 2022 | $647,800 | $551,200 | -14.9% | -25.2% | Aug 2024 | -0.7% | GVR MLS HPI, October 2026 |
| Squamish | Jun 2022 | $704,400 | $599,600 | -14.9% | -24.1% | Nov 2023 | -4.8% | GVR MLS HPI, October 2026 |
| West Vancouver | Aug 2023 | $1,342,400 | $1,142,600 | -14.9% | -20.6% | Jun 2024 | -1.0% | GVR MLS HPI, October 2026 |
| Burnaby North | May 2022 | $770,400 | $660,400 | -14.3% | -23.7% | Apr 2024 | -0.1% | GVR MLS HPI, October 2026 |
| Vancouver West | May 2022 | $867,600 | $751,400 | -13.4% | -22.9% | Jul 2023 | -1.1% | GVR MLS HPI, October 2026 |
| Greater Vancouver (board) | Apr 2024 | $776,500 | $673,400 | -13.3% | -18.2% | May 2022 | -0.2% | GVR MLS HPI, October 2026 |
| Vancouver East | May 2024 | $718,700 | $635,100 | -11.6% | -16.0% | Aug 2023 | -0.0% | GVR MLS HPI, October 2026 |
| North Vancouver | May 2022 | $830,000 | $736,300 | -11.3% | -21.0% | Jun 2024 | -0.4% | GVR MLS HPI, October 2026 |
| Port Moody | Jul 2024 | $757,000 | $680,000 | -10.2% | -14.3% | May 2025 | -1.6% | GVR MLS HPI, October 2026 |
-0.2%: Greater Vancouver condos in May 2022 against the April 2024 peak: two peaks almost level. (Strawhomes calculation from Greater Vancouver REALTORS MLS HPI releases, 2026)
Condo prices in the core of the Vancouver market never made a clean break with 2022. A buyer in either spring is down by about the same amount today (Strawhomes calculation from Greater Vancouver REALTORS MLS HPI releases, 2026). Richmond condos are 17.9% below May 2024 and New Westminster condos 15.5% below September 2024. Our count of unsold new condos by city shows where new housing supply is still waiting for buyers.
At the shallow end, Port Moody condos are 10.2% below a July 2024 peak, the smallest condo drop in the region (Strawhomes calculation from Greater Vancouver REALTORS MLS HPI releases, 2026), and Burnaby North condos are 14.3% below May 2022. The Sunshine Coast is the outlier: its condo benchmark is 26.2% below June 2022, and 34.2% below it in real terms (Strawhomes calculation from Greater Vancouver REALTORS MLS HPI releases and Statistics Canada CPI, 2026).
Do Actual Sales Agree With the Benchmark? Two Years of Data for Buyers and Sellers
Mostly, and sold prices fell slightly more. In all 26 city and type pairs we could match, both Strawhomes MLS sold medians and the benchmark fell between late 2024 and the offers accepted from August 2026 to October 2026 (Strawhomes MLS sold data, 2026). The median sold-price change was -12.8% against -10.4% for the benchmark.
| City and type | Median, Nov 2024 to Jan 2025 | Median, Aug to Oct 2026 | Sold median change | Benchmark change | Source |
|---|---|---|---|---|---|
| Abbotsford condo | $432,000 | $361,000 | -16.4% | -14.9% | Strawhomes MLS sold data |
| Abbotsford detached | $1,173,500 | $1,025,000 | -12.7% | -10.7% | Strawhomes MLS sold data |
| Abbotsford townhouse | $686,000 | $629,950 | -8.2% | -10.6% | Strawhomes MLS sold data |
| Coquitlam condo | $688,000 | $598,000 | -13.1% | -12.2% | Strawhomes MLS sold data |
| Coquitlam detached | $1,750,000 | $1,514,000 | -13.5% | -9.5% | Strawhomes MLS sold data |
| Coquitlam townhouse | $1,169,950 | $974,950 | -16.7% | -7.9% | Strawhomes MLS sold data |
| Langley condo | $550,000 | $490,000 | -10.9% | -11.8% | Strawhomes MLS sold data |
| Langley detached | $1,615,000 | $1,320,000 | -18.3% | -9.3% | Strawhomes MLS sold data |
| Langley townhouse | $853,000 | $789,500 | -7.4% | -7.2% | Strawhomes MLS sold data |
| Maple Ridge condo | $527,500 | $452,500 | -14.2% | -10.3% | Strawhomes MLS sold data |
| Maple Ridge detached | $1,300,000 | $1,183,750 | -8.9% | -9.6% | Strawhomes MLS sold data |
| Maple Ridge townhouse | $800,000 | $695,000 | -13.1% | -11.1% | Strawhomes MLS sold data |
| Mission detached | $1,057,000 | $868,500 | -17.8% | -12.1% | Strawhomes MLS sold data |
| New Westminster condo | $635,000 | $540,000 | -15.0% | -11.9% | Strawhomes MLS sold data |
| North Vancouver condo | $801,250 | $749,450 | -6.5% | -4.5% | Strawhomes MLS sold data |
| North Vancouver detached | $2,172,944 | $2,100,000 | -3.4% | -4.0% | Strawhomes MLS sold data |
| North Vancouver townhouse | $1,289,000 | $1,280,000 | -0.7% | -8.4% | Strawhomes MLS sold data |
| Port Coquitlam condo | $593,500 | $560,000 | -5.6% | -12.2% | Strawhomes MLS sold data |
| Port Coquitlam detached | $1,400,000 | $1,245,000 | -11.1% | -10.7% | Strawhomes MLS sold data |
| Port Coquitlam townhouse | $992,500 | $854,000 | -14.0% | -9.1% | Strawhomes MLS sold data |
| Port Moody condo | $746,500 | $711,450 | -4.7% | -8.9% | Strawhomes MLS sold data |
| Richmond condo | $671,000 | $585,000 | -12.8% | -13.1% | Strawhomes MLS sold data |
| Richmond detached | $2,012,500 | $1,646,500 | -18.2% | -12.7% | Strawhomes MLS sold data |
| Richmond townhouse | $1,159,990 | $970,000 | -16.4% | -10.0% | Strawhomes MLS sold data |
| West Vancouver detached | $3,037,500 | $2,760,000 | -9.1% | -11.9% | Strawhomes MLS sold data |
| Whistler condo | $630,000 | $628,000 | -0.3% | -7.6% | Strawhomes MLS sold data |
In the recent market, home sales say the same as the index: prices are lower for home buyers actively in the market today. Sold medians fell more than the benchmark in 16 of 26 pairs (Strawhomes MLS sold data, 2026). Richmond detached medians changed by -18.2% against -12.7% for the benchmark, which suggests that more modest houses made up a larger share of recent sales. A median moves with the mix of homes sold, which is why our Richmond market report can swing more than the index does; the difference is explained in average versus median real estate prices.
Where the two disagree most, sample size is the usual reason. Whistler condo medians were almost flat (-0.3%) while the benchmark changed by -7.6% (Strawhomes MLS sold data, 2026). For a household deciding whether today's lower prices bring affordable housing within reach in today's market, our income needed to buy a home by city sets these prices against local incomes. One caution for anyone checking these numbers against old headlines: peak prices printed in 2022 releases are on an older version of the index and do not compare with today's.
Peak Price Checker: Which Benchmark Homes Fit Your Budget, and How Far Below Peak Are They?
Peak Price Checker: Which Benchmark Homes Fit Your Budget, and How Far Below Peak Are They?
Enter a budget to see which markets' benchmark home is at or below it today, with each market's own peak price and how far it has fallen. Benchmark prices are October 2026 (Chilliwack and District: September 2026).
| Market | Latest benchmark | Home type | Peak benchmark | Change from peak | After inflation |
|---|---|---|---|---|---|
| North Surrey (Peak Apr 2022) | $392,300 | Condo | $535,200 | -26.7% | -35.5% |
| North Delta (Peak Apr 2022) | $475,700 | Condo | $645,700 | -26.3% | -35.2% |
| Sunshine Coast (Peak Jun 2022) | $462,300 | Condo | $626,700 | -26.2% | -34.2% |
| Surrey (Peak Apr 2022) | $453,600 | Condo | $600,300 | -24.4% | -33.5% |
| Abbotsford (Peak Apr 2022) | $370,300 | Condo | $482,900 | -23.3% | -32.6% |
| Whistler (Peak Jun 2022) | $612,500 | Condo | $785,400 | -22% | -30.4% |
| Fraser Valley (board) (Peak Apr 2022) | $460,800 | Condo | $579,200 | -20.4% | -30% |
| Cloverdale (Peak Apr 2022; May 2023 within 1%) | $501,800 | Condo | $630,500 | -20.4% | -30% |
| Mission (Peak Jun 2022) | $396,200 | Condo | $497,300 | -20.3% | -28.9% |
| Maple Ridge (Peak May 2022) | $481,600 | Condo | $600,000 | -19.7% | -28.5% |
| Pitt Meadows (Peak Apr 2022; Oct 2024 within 1%) | $523,500 | Condo | $644,700 | -18.8% | -28.6% |
| Langley (Peak Apr 2022) | $522,300 | Condo | $639,200 | -18.3% | -28.1% |
| Richmond (Peak May 2024) | $625,700 | Condo | $761,700 | -17.9% | -21.9% |
| Coquitlam (Peak Apr 2022; Apr 2024 within 1%) | $624,200 | Condo | $756,700 | -17.5% | -27.4% |
| Tsawwassen (Peak May 2022; Jun 2024 within 1%) | $588,800 | Condo | $710,100 | -17.1% | -26.2% |
| Ladner (Peak May 2022) | $620,000 | Condo | $741,600 | -16.4% | -25.6% |
| Burnaby East (Peak Apr 2022) | $698,800 | Condo | $829,900 | -15.8% | -25.9% |
| New Westminster (Peak Sep 2024) | $565,900 | Condo | $669,700 | -15.5% | -19.5% |
| Burnaby South (Peak Sep 2023; Apr 2024 within 1%) | $716,500 | Condo | $845,700 | -15.3% | -20.6% |
| Port Coquitlam (Peak Apr 2022; Aug 2024 within 1%) | $551,200 | Condo | $647,800 | -14.9% | -25.2% |
| Squamish (Peak Jun 2022) | $599,600 | Condo | $704,400 | -14.9% | -24.1% |
| West Vancouver (Peak Aug 2023) | $1,142,600 | Condo | $1,342,400 | -14.9% | -20.6% |
| Chilliwack and District (board) (Peak May 2022) | $387,700 | Condo | $453,800 | -14.6% | -23.9% |
| Burnaby North (Peak May 2022; Apr 2024 within 1%) | $660,400 | Condo | $770,400 | -14.3% | -23.7% |
| South Surrey and White Rock (Peak Mar 2022; Sep 2024 within 1%) | $558,600 | Condo | $649,100 | -13.9% | -25% |
| Vancouver West (Peak May 2022) | $751,400 | Condo | $867,600 | -13.4% | -22.9% |
| Greater Vancouver (board) (Peak Apr 2024; May 2022 within 1%) | $673,400 | Condo | $776,500 | -13.3% | -18.2% |
| Vancouver East (Peak May 2024; Aug 2023 within 1%) | $635,100 | Condo | $718,700 | -11.6% | -16% |
| North Vancouver (Peak May 2022; Jun 2024 within 1%) | $736,300 | Condo | $830,000 | -11.3% | -21% |
| Port Moody (Peak Jul 2024) | $680,000 | Condo | $757,000 | -10.2% | -14.3% |
| Mission (Peak Mar 2022) | $883,300 | Detached | $1,337,400 | -34% | -42.5% |
| North Delta (Peak Mar 2022) | $1,165,900 | Detached | $1,661,300 | -29.8% | -38.9% |
| Abbotsford (Peak Mar 2022) | $1,090,500 | Detached | $1,551,300 | -29.7% | -38.8% |
| North Surrey (Peak Apr 2022) | $1,254,500 | Detached | $1,758,300 | -28.7% | -37.2% |
| Surrey (Peak Mar 2022) | $1,288,000 | Detached | $1,793,100 | -28.2% | -37.4% |
| Fraser Valley (board) (Peak Mar 2022) | $1,293,800 | Detached | $1,765,900 | -26.7% | -36.2% |
| Cloverdale (Peak Mar 2022) | $1,326,400 | Detached | $1,781,500 | -25.5% | -35.1% |
| South Surrey and White Rock (Peak Apr 2022) | $1,606,500 | Detached | $2,119,000 | -24.2% | -33.3% |
| Chilliwack and District (board) (Peak Feb 2022) | $861,300 | Detached | $1,125,200 | -23.5% | -34.4% |
| Maple Ridge (Peak Mar 2022) | $1,138,500 | Detached | $1,479,000 | -23% | -32.9% |
| Langley (Peak Mar 2022) | $1,448,100 | Detached | $1,875,400 | -22.8% | -32.7% |
| Pitt Meadows (Peak Mar 2022) | $1,172,600 | Detached | $1,509,800 | -22.3% | -32.3% |
| Port Coquitlam (Peak Mar 2022) | $1,235,900 | Detached | $1,551,600 | -20.3% | -30.6% |
| Bowen Island (Peak May 2022) | $1,398,200 | Detached | $1,740,400 | -19.7% | -28.5% |
| Coquitlam (Peak Apr 2022) | $1,571,400 | Detached | $1,924,900 | -18.4% | -28.2% |
| New Westminster (Peak May 2024; Mar 2022 within 1%) | $1,347,700 | Detached | $1,650,800 | -18.4% | -22.4% |
| Sunshine Coast (Peak May 2022) | $850,200 | Detached | $1,041,300 | -18.4% | -27.3% |
| Richmond (Peak Aug 2024; Apr 2022 within 1%) | $1,833,100 | Detached | $2,222,500 | -17.5% | -21.3% |
| West Vancouver (Peak Jun 2022) | $2,864,900 | Detached | $3,464,900 | -17.3% | -26.2% |
| Vancouver East (Peak May 2022) | $1,610,700 | Detached | $1,945,800 | -17.2% | -26.3% |
| Vancouver West (Peak Apr 2022; Jun 2024 within 1%) | $2,899,700 | Detached | $3,502,700 | -17.2% | -27.2% |
| Burnaby South (Peak May 2024) | $1,904,400 | Detached | $2,292,000 | -16.9% | -21% |
| Ladner (Peak Mar 2022) | $1,262,500 | Detached | $1,518,000 | -16.8% | -27.6% |
| Burnaby North (Peak Jun 2024; Apr 2025 within 1%) | $1,795,200 | Detached | $2,132,100 | -15.8% | -20.1% |
| Tsawwassen (Peak May 2022) | $1,469,500 | Detached | $1,743,100 | -15.7% | -24.9% |
| Burnaby East (Peak Aug 2024; Mar 2025 within 1%) | $1,681,600 | Detached | $1,987,000 | -15.4% | -19.3% |
| Port Moody (Peak Sep 2024; May 2022 within 1%) | $1,868,000 | Detached | $2,204,200 | -15.3% | -19.3% |
| Greater Vancouver (board) (Peak Apr 2022) | $1,775,200 | Detached | $2,084,400 | -14.8% | -25.1% |
| North Vancouver (Peak Mar 2022) | $2,058,800 | Detached | $2,372,800 | -13.2% | -24.4% |
| Whistler (Peak Jul 2022) | $2,646,200 | Detached | $2,930,700 | -9.7% | -19% |
| Squamish (Peak Jun 2022) | $1,681,800 | Detached | $1,790,100 | -6.1% | -16.2% |
| South Surrey and White Rock (Peak Mar 2022) | $800,900 | Townhouse | $1,060,300 | -24.5% | -34.2% |
| Maple Ridge (Peak Mar 2022) | $686,600 | Townhouse | $905,600 | -24.2% | -34% |
| Abbotsford (Peak Jun 2022) | $579,600 | Townhouse | $765,000 | -24.2% | -32.4% |
| Surrey (Peak Mar 2022) | $744,300 | Townhouse | $961,100 | -22.6% | -32.5% |
| North Surrey (Peak Mar 2022) | $671,000 | Townhouse | $856,300 | -21.6% | -31.7% |
| Cloverdale (Peak Mar 2022) | $757,900 | Townhouse | $960,400 | -21.1% | -31.3% |
| Fraser Valley (board) (Peak Apr 2022) | $742,300 | Townhouse | $929,000 | -20.1% | -29.7% |
| North Delta (Peak Mar 2022) | $867,500 | Townhouse | $1,086,100 | -20.1% | -30.4% |
| Port Moody (Peak May 2022) | $895,800 | Townhouse | $1,111,200 | -19.4% | -28.2% |
| Pitt Meadows (Peak May 2022) | $731,800 | Townhouse | $903,600 | -19% | -27.9% |
| Chilliwack and District (board) (Peak Feb 2022) | $580,600 | Townhouse | $710,400 | -18.3% | -30% |
| Mission (Peak May 2022) | $606,100 | Townhouse | $730,100 | -17% | -26.1% |
| Tsawwassen (Peak Mar 2022) | $878,400 | Townhouse | $1,057,200 | -16.9% | -27.6% |
| Port Coquitlam (Peak Apr 2022) | $854,900 | Townhouse | $1,021,600 | -16.3% | -26.4% |
| Coquitlam (Peak Apr 2022) | $962,600 | Townhouse | $1,140,500 | -15.6% | -25.8% |
| Vancouver West (Peak Dec 2024) | $1,285,000 | Townhouse | $1,523,200 | -15.6% | -19.2% |
| Langley (Peak May 2022) | $800,600 | Townhouse | $946,500 | -15.4% | -24.7% |
| North Vancouver (Peak May 2024; Mar 2022 within 1%) | $1,221,100 | Townhouse | $1,429,900 | -14.6% | -18.8% |
| Richmond (Peak May 2024) | $1,009,300 | Townhouse | $1,175,100 | -14.1% | -18.4% |
| Ladner (Peak May 2025; Mar 2024 within 1%) | $909,300 | Townhouse | $1,049,700 | -13.4% | -15.8% |
| Burnaby South (Peak Jun 2024; May 2022 within 1%) | $922,900 | Townhouse | $1,060,100 | -12.9% | -17.4% |
| Greater Vancouver (board) (Peak Apr 2022; May 2024 within 1%) | $1,006,500 | Townhouse | $1,145,300 | -12.1% | -22.7% |
| Whistler (Peak May 2024) | $1,621,200 | Townhouse | $1,841,000 | -11.9% | -16.3% |
| Burnaby East (Peak Jul 2024) | $839,300 | Townhouse | $946,400 | -11.3% | -15.4% |
| Burnaby North (Peak May 2022) | $873,000 | Townhouse | $981,600 | -11.1% | -20.8% |
| New Westminster (Peak May 2022; Sep 2023 within 1%) | $852,000 | Townhouse | $958,200 | -11.1% | -20.8% |
| Sunshine Coast (Peak May 2024) | $708,600 | Townhouse | $797,300 | -11.1% | -15.5% |
| Squamish (Peak Mar 2022; May 2024 within 1%) | $968,600 | Townhouse | $1,075,100 | -9.9% | -21.5% |
| Vancouver East (Peak Mar 2025; Mar 2022 within 1%) | $1,055,800 | Townhouse | $1,149,700 | -8.2% | -11.7% |
How These Numbers Work
The MLS Home Price Index (HPI) prices a typical, constant-quality home in each area, so it tracks demand and supply, not which homes happened to sell in a month. Each board revises the index once a year, which changes past values. To keep one consistent series, we read every monthly release from February 2024 to October 2026, took the within-release changes each one prints (1, 3 and 6 months, and 1, 3, 5 and 10 years) and joined them in a weighted least-squares chain anchored on the October 2026 index, weighting the current-vintage releases most.
The chain reproduces the board peak months in CREA's current-vintage history in 8 of 8 cases, and its peak-to-September-2026 drops sit within 0.3 points of CREA's (Strawhomes check against CREA MLS HPI data, 2026). A market's peak is the highest month from January 2021 to its latest release. Peak prices are the latest benchmark scaled by the index, so they are in current-vintage dollars, not the dollars printed in a 2022 press release.
After inflation means the change in the benchmark divided by the change in Vancouver's all-items consumer price index from the peak month to September 2026, the latest month published: for an April 2022 peak, that is 146.7 to 166.8 (Statistics Canada, Table 18-10-0004-01, 2026). For the background, see our article on real estate prices and inflation.
Frequently Asked Questions
How far are Vancouver home prices, and house prices in particular, below the 2022 peak?
On the October 2026 MLS HPI, the Greater Vancouver detached benchmark is 14.8% below its April 2022 peak, at $1,775,200. Townhouses are 12.1% below April 2022. Condos peaked again in April 2024 and are 13.3% below that level. Each figure is measured on one consistent, current-vintage series. (Strawhomes calculation from Greater Vancouver REALTORS MLS HPI releases, 2026)
Which city has dropped the most from its peak in the Vancouver housing market?
Mission detached houses: the benchmark fell from $1,337,400 in March 2022 to $883,300 in October 2026, a drop of 34.0%. North Delta detached (29.8% down) and Abbotsford detached (29.7% down) follow. The ten deepest drops are all in the Fraser Valley board area or on the Sunshine Coast. (Strawhomes calculation from Fraser Valley Real Estate Board MLS HPI releases, 2026)
Have Fraser Valley prices fallen more than Vancouver prices?
Yes. The Fraser Valley detached benchmark is 26.7% below its March 2022 peak, against 14.8% for Greater Vancouver detached. Every one of the 24 Fraser Valley sub-area markets peaked in 2022, and the Fraser Valley condo benchmark is 20.4% below its April 2022 high. (Strawhomes calculation from Fraser Valley Real Estate Board MLS HPI releases, 2026)
How much have home prices fallen after inflation, to September 2026?
More. Vancouver's consumer price index rose from 146.7 in April 2022 to 166.8 in September 2026, so the Greater Vancouver detached benchmark is 25.1% below its April 2022 peak in real terms. Mission detached is 42.5% below in real terms, and 29 of 90 markets are at least 30% down. (Strawhomes calculation from Greater Vancouver REALTORS MLS HPI releases and Statistics Canada CPI, 2026)
Did condo prices peak in 2022 or 2024?
Both, nearly equally. The Greater Vancouver condo benchmark peaked in April 2024, only 0.2% above its May 2022 level, and is 13.3% below it now. Richmond, New Westminster, Vancouver East and Port Moody condos also peaked in 2024, while every Fraser Valley sub-area condo market peaked in 2022. (Strawhomes calculation from Greater Vancouver REALTORS MLS HPI releases, 2026)
Why do a realtor and other reports give different drops from the peak?
A real estate agent may quote an average sale price, while this table uses the benchmark for a typical property. The MLS HPI is also revised every year, so a peak price printed in a 2022 release does not match the same month on today's series and can overstate or understate the fall. Averages and medians move with the mix of homes sold: Strawhomes MLS sold medians fell more than the benchmark in 16 of 26 city and type pairs since late 2024. (Strawhomes MLS sold data, 2026)
Are Vancouver real estate prices still falling in the 2026 market?
Yes, benchmark prices are falling on the latest releases, more than four years after the Bank of Canada began raising its policy rate in 2022. Over the year to October 2026 the Greater Vancouver detached benchmark fell 7.0%, townhouses 5.5% and condos 5.9%. In the Fraser Valley, the board's October 2026 release shows detached fell 8.5%, townhouses 5.5% and condos 8.1% (Fraser Valley Real Estate Board). None of the benchmarks shows a turn in demand yet, so some may call this a normalizing market, but the data still shows downward pressure on home prices and cannot call a bottom. (Greater Vancouver REALTORS, October 2026, 2026)
What does the drop mean for a first-time buyer and their mortgage?
Lower home costs. The Greater Vancouver condo benchmark is $673,400, $103,100 below its April 2024 peak, so a first-time buyer needs less cash and a smaller mortgage payment for the same property. What buyers need to know in 2026 is the risk on the other side: leverage cuts both ways, and prices have not turned yet, so pick the right home for the long run. (Strawhomes calculation from Greater Vancouver REALTORS MLS HPI releases, 2026)
Methodology
This is a chain-linked reading of public MLS HPI releases from Greater Vancouver REALTORS (formerly the Real Estate Board of Greater Vancouver, 20 sub-areas) and the Fraser Valley Real Estate Board (8 sub-areas), plus the Chilliwack and District board series from CREA's HPI download, for detached, townhouse and apartment (condo) benchmarks: 90 markets in all. We read 64 monthly releases (30 from GVR, February 2024 to October 2026 without January 2025, June and July 2026, which are not online or not machine-readable, and 34 from the Fraser Valley board, January 2024 to October 2026) and fitted one log-index series per market; the fit's typical error is under 1% and the board-level result was checked against CREA's own history. Where a market has two highs within 1% of each other, both months are shown. The HPI covers board sub-areas, so Burnaby, Vancouver, Delta and Surrey appear in parts, and the boards' map is not the Metro Vancouver Regional District's: the City of Vancouver is split into Vancouver West (the West Side, Downtown Vancouver, Yaletown and Kitsilano) and Vancouver East (East Vancouver; Mount Pleasant, Vancouver is split between the two), Burnaby North runs along the Millennium Line SkyTrain, Burnaby South takes in Metrotown, Burnaby's largest town centre, and Surrey, British Columbia is split into North Surrey, Surrey, Cloverdale and South Surrey and White Rock. Apartment means an apartment condominium (condo). Langley combines the City and Township, and smaller towns on the Sunshine Coast, in the Gulf Islands and up the Fraser Canyon are not benchmarked. The sales cross-check uses Strawhomes MLS sold data (offers accepted, Bridge pending date, the sale set used on our market stats pages), medians where both windows had at least 30 sales; our MLS history starts in November 2024, so it cannot reach the 2022 peak itself. Board-wide average prices come from the Fraser Valley board's own February 2022 and October 2026 packages. Topic research: some search results came from a backup search provider; the angle pass and this build ran without degradation.
Sources consulted: 70
Sources cited: 6
Data freshness: current year: 4, last year: 0, older: 2
Data range: MLS HPI releases February 2024 to October 2026 (history back to January 2021); CPI January 2021 to September 2026; MLS sales November 2024 to October 2026
Research date: 2026-11-13
Update schedule: Monthly, with each new board release
Limitations: Peak months and peak prices are chain-linked from 64 monthly board releases, not printed by the boards. The MLS HPI covers board sub-areas, not every municipality: Burnaby, Vancouver, Delta and Surrey are split into sub-areas, Langley combines the City and Township, and smaller towns outside these areas are not benchmarked. Chilliwack and District is a board-level series and ends in September 2026. Real terms use Vancouver CPI to September 2026, the latest month published.
Sources & References
- Greater Vancouver REALTORS. "Monthly Market Report and MLS HPI tables, October 2026." members.gvrealtors.ca/news/GVR-Stats-Package-October-2026.pdf. Accessed 2026-11-13.
- Fraser Valley Real Estate Board. "Monthly Statistics Package, October 2026." fvreb.bc.ca/statistics/Package202610.pdf. Accessed 2026-11-13.
- Canadian Real Estate Association. "MLS Home Price Index data download, October 2026 release." crea.ca/files/mls-hpi-data/MLS_HPI_Oct_2026.zip. Accessed 2026-11-13.
- Statistics Canada. "Consumer Price Index, monthly, not seasonally adjusted (Table 18-10-0004-01), Vancouver all-items." www150.statcan.gc.ca/t1/wds/rest/getDataFromVectorByReferencePeriodRange?vectorI. Accessed 2026-11-13.
- Fraser Valley Real Estate Board. "Monthly Statistics Package, February 2022." fvreb.bc.ca/statistics/Package202202.pdf. Accessed 2026-11-13.
- Strawhomes. "Real Estate Market Stats (MLS sold data by city and type)." strawhomes.com/mls/trends/. Accessed 2026-11-13.

Let's Chat! Looking for a REALTOR® who can exceed your expectations? Look no further than Richard Morrison! His mission is to serve without limit & provide solutions that cater to your core needs.
• 20+ Years of Experience
• Medallion Member
• RE/MAX Hall of Fame

Latest Properties Added
| Property | Size | Price | Date Listed |
|---|---|---|---|
| 503 - 588 Harrison Avenue, Coquitlam | 568 sqft | $549,000 | Nov 12, 2026 |
| 309 - 3883 Laurel Street, Burnaby | 681 sqft | $419,000 | Nov 13, 2026 |
| 169 - 3507 Hall Avenue, Coquitlam | 1,673 sqft | $1,099,000 | Nov 11, 2026 |
| 1 - 6118 Irmin Street, Burnaby | 1,840 sqft | $1,499,000 | Nov 11, 2026 |
| 96 - 9339 Alberta Road, Richmond | 550 sqft | $349,800 | Nov 12, 2026 |
| 48 - 8050 204 Street, Langley | 1,351 sqft | $789,900 | Nov 13, 2026 |
| 1588 Charland Avenue, Coquitlam | 101 sqft | $2,500,000 | Nov 13, 2026 |
| 13 - 1949 8th Avenue, Vancouver | 707 sqft | $699,000 | Nov 12, 2026 |
| 1306 - 901 Lougheed Highway, Coquitlam | 705 sqft | $548,000 | Nov 13, 2026 |
| 729 Keith Road, North Vancouver | 1,665 sqft | $1,799,999 | Nov 13, 2026 |
| 1 - 6040 Larch Street, Vancouver | 1,617 sqft | $2,198,000 | Nov 12, 2026 |
| 103 - 6111 Dyke Road, Richmond | 1,404 sqft | $1,558,800 | Nov 13, 2026 |
Start your search with Richard Morrison, Top Award Winning Vancouver Realtor
Contact Richard Morrison Top Vancouver Realtor today to find a Vancouver houses for sale and Vancouver condos for sale. Also check out Burnaby houses for sale or maybe Burnaby condos for sale. If you prefer North Shore, take a look at our listings in North Vancouver houses for sale and North Vancouver condos for sale.