Homes Selling Over Asking by City: Metro Vancouver and Fraser Valley (2026)
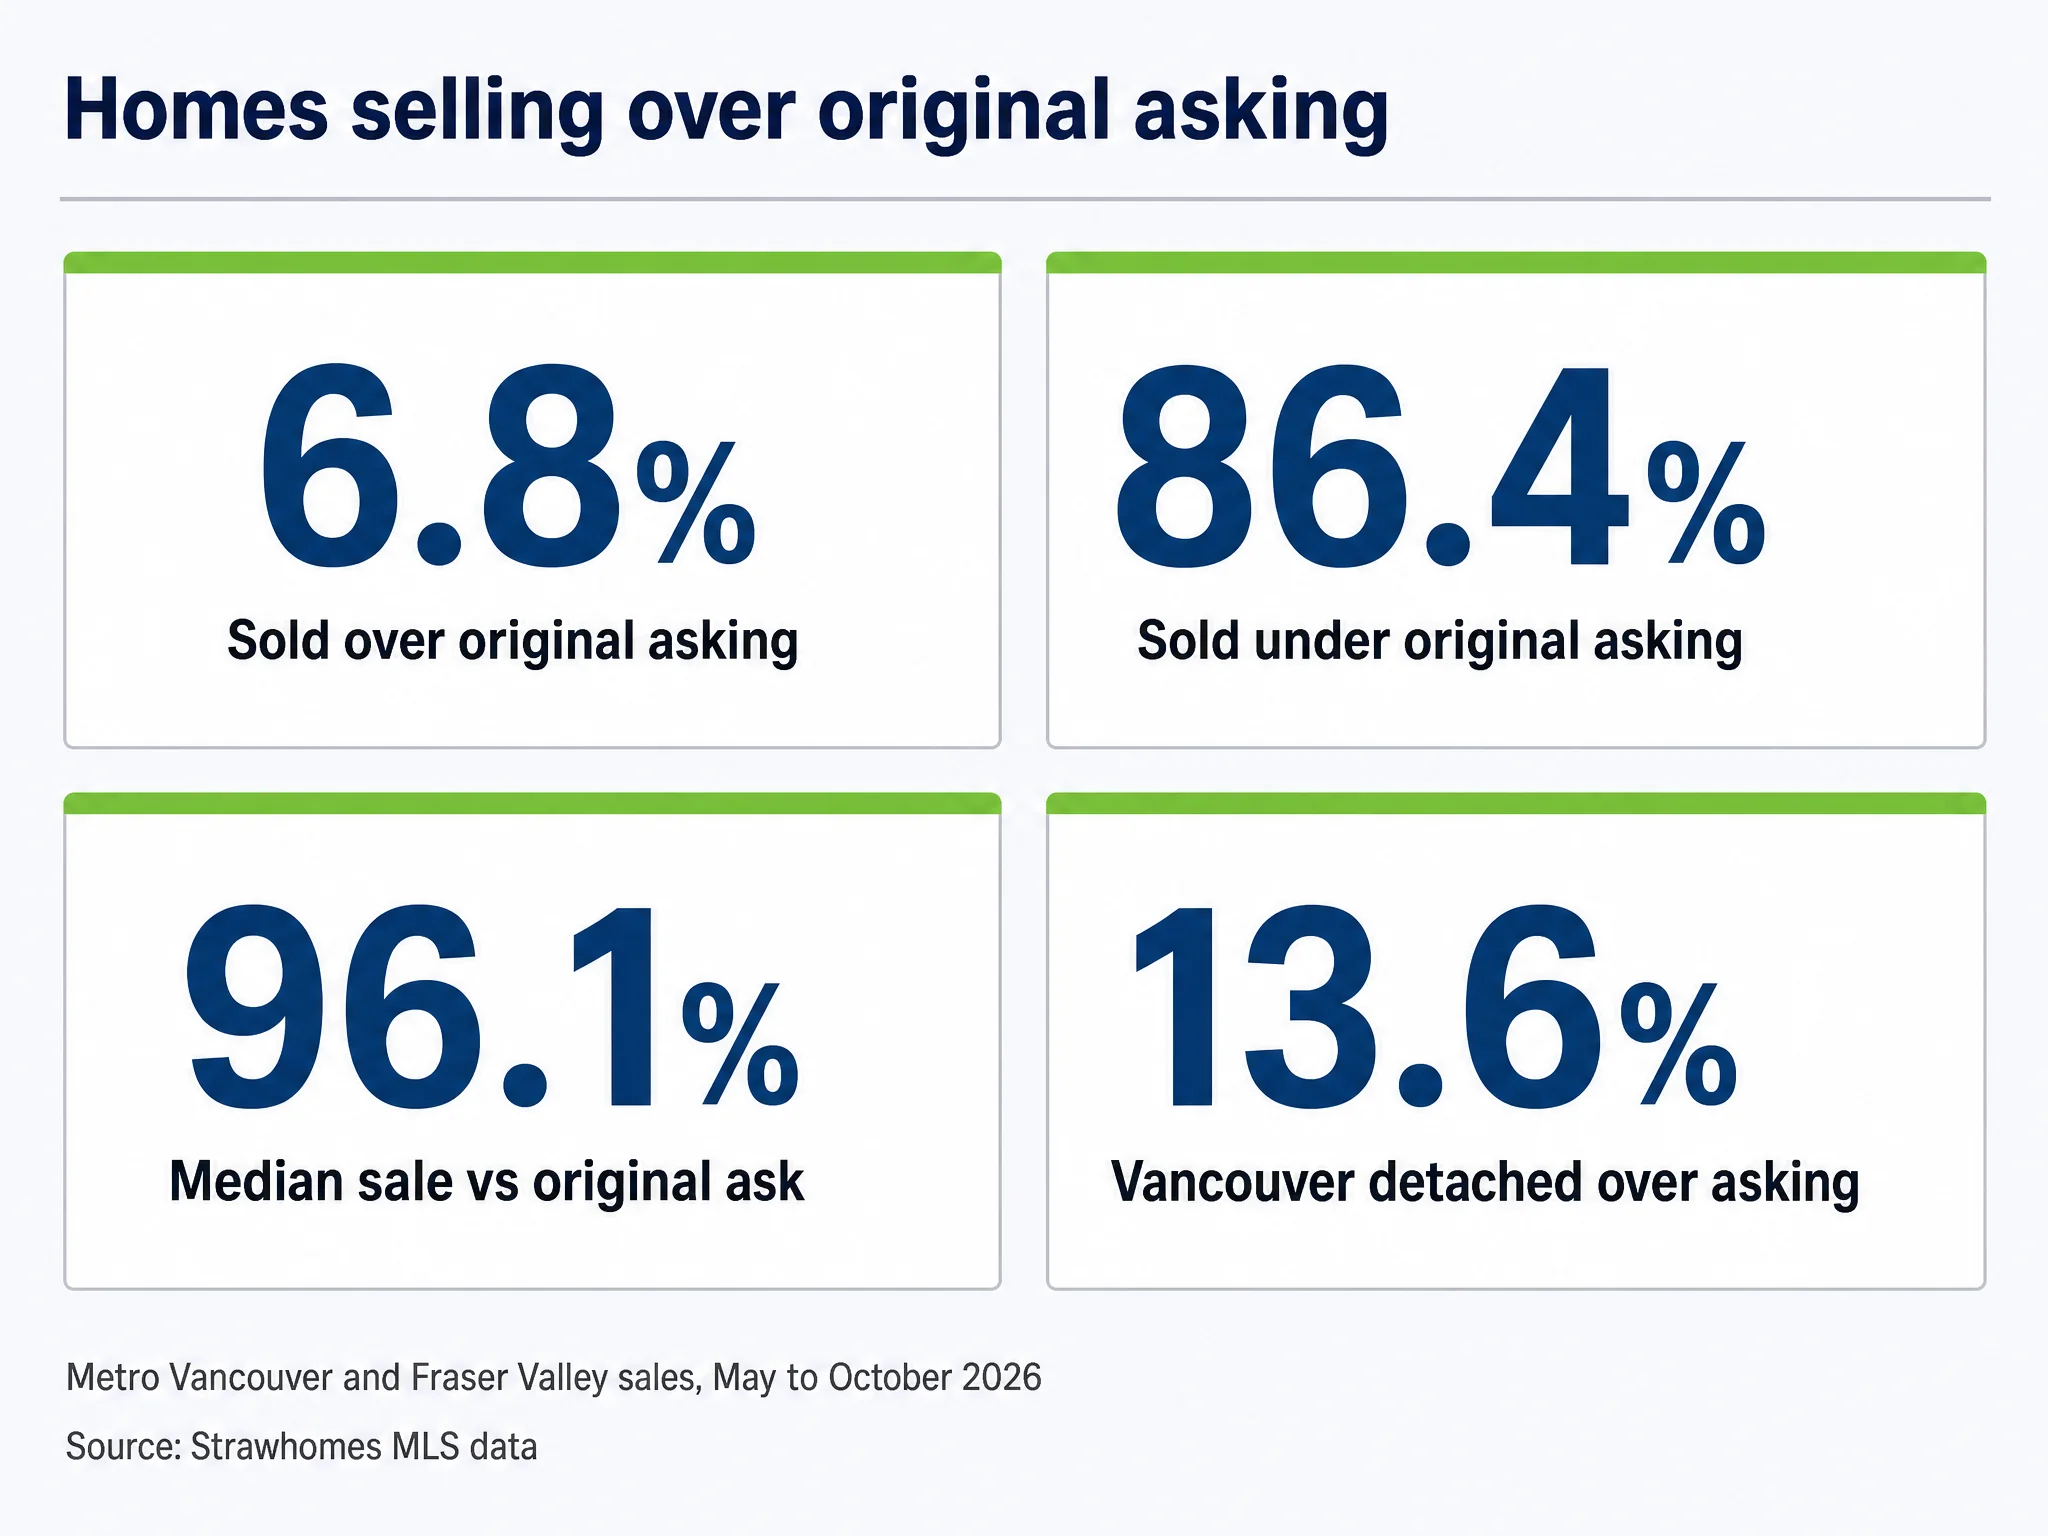
6.8%: 6.8% of the 17,851 Metro Vancouver and Fraser Valley home sales that went firm from May to October 2026 closed above the home's original asking price; 86.4% closed below it. Source: Strawhomes MLS data (2026)
Key Takeaways
- 86.4% of firm sales from May to October 2026 closed below the original asking price; the shares over asking and exactly at asking were both 6.8%. (Strawhomes MLS data, 2026)
- 96.1% is the median sale price as a share of the original asking price across both regions, May to October 2026. (Strawhomes MLS data, 2026)
- 13.6% of Vancouver detached houses sold over original asking, the highest of any city and home type with 30 or more sales. (Strawhomes MLS data, 2026)
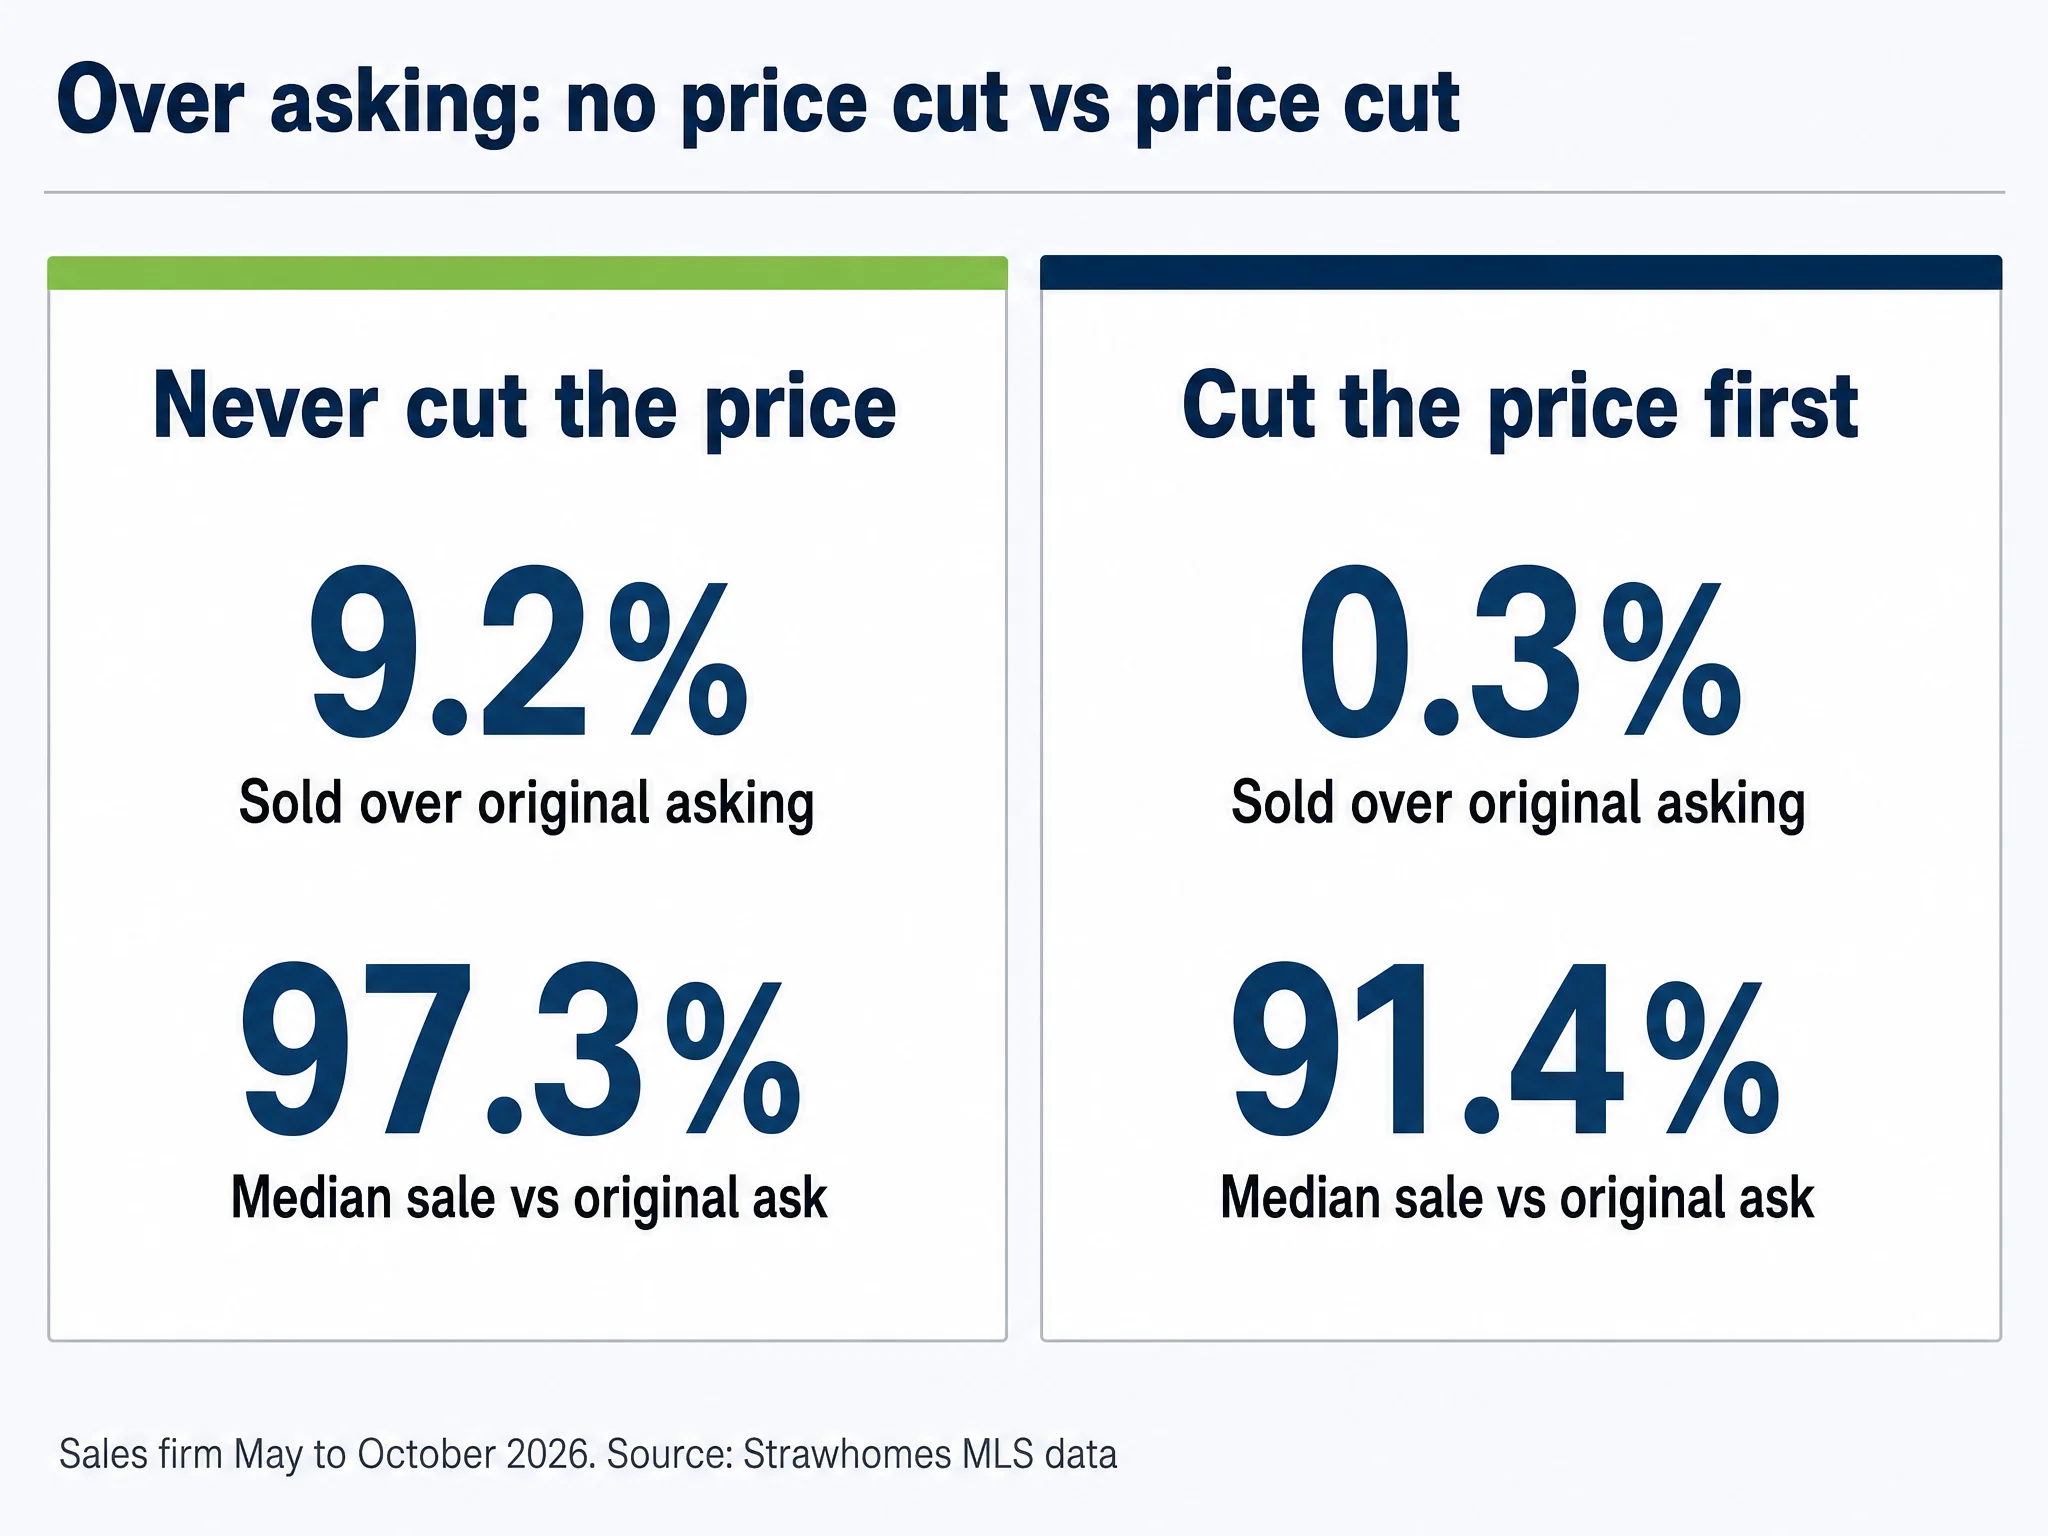
- 9.2% of homes that never cut their price sold over original asking, against 0.3% of homes that cut it first. (Strawhomes MLS data, 2026)
- 26.5% of homes sold from May to October 2026 had their list price cut before the sale. (Strawhomes MLS data, 2026)
- 8.8% sold over original asking in the same months of 2025, so the share has fallen to 6.8%. (Strawhomes MLS data, 2026)
- 17.0% of March 2025 sales went over original asking, the monthly high since November 2024; October 2026 was 6.6%. (Strawhomes MLS data, 2026)
Only 6.8% of homes that sold in Metro Vancouver and the Fraser Valley from May to October 2026 went for more than the seller's original asking price (Strawhomes MLS data, 2026). 86.4% sold for less, and the median home closed at 96.1% of the price it first listed at. That is the answer to the question every buyer asks before an offer: should I expect a bidding war here? In most places and for most homes, no.
This is original research from Strawhomes MLS data: 17,851 sales that went firm in the six months to October 31, 2026, split by city and by home type (detached, townhouse, apartment). "Asking" here means the ORIGINAL list price, the price the seller first asked, not the final price after any cuts. Our own city pages, such as the Vancouver neighbourhood rankings, rank areas by sales above the final list price, so their figures are a different measure and the two should not be compared one to one.
Three findings stand out. Vancouver detached houses are the most likely to sell over asking, at 13.6%. A home that never cut its price had a 9.2% chance of selling over the original ask, while a home that cut first almost never did. And the over-asking share is lower than a year ago: 8.8% in the same months of 2025.
What Percentage of Homes Sell Over Asking in the Metro Vancouver and Fraser Valley Housing Market?
6.8% of firm sales from May to October 2026 closed above the original asking price, 6.8% closed exactly at it and 86.4% closed below it (Strawhomes MLS data, 2026). Metro Vancouver ran at 7.0% over asking and the Fraser Valley at 5.3%. Apartments, townhouses and detached houses all sit within about a point of each other.
| Area and home type | Over original ask | At ask | Under ask | Median sale to original ask | Sales | Source |
|---|---|---|---|---|---|---|
| Both regions, all home types | 6.8% | 6.8% | 86.4% | 96.1% | 17,851 | Strawhomes MLS data |
| Both regions, detached | 7.2% | 3.2% | 89.7% | 95.1% | 6,432 | Strawhomes MLS data |
| Both regions, townhouse | 7.0% | 10.1% | 82.9% | 97.0% | 4,414 | Strawhomes MLS data |
| Both regions, apartment | 6.4% | 8.1% | 85.5% | 96.2% | 7,005 | Strawhomes MLS data |
| Metro Vancouver, all home types | 7.0% | 7.1% | 85.9% | 96.1% | 15,649 | Strawhomes MLS data |
| Metro Vancouver, detached | 7.4% | 3.2% | 89.4% | 95.1% | 5,199 | Strawhomes MLS data |
| Metro Vancouver, townhouse | 7.6% | 10.0% | 82.4% | 97.0% | 3,882 | Strawhomes MLS data |
| Metro Vancouver, apartment | 6.4% | 8.4% | 85.2% | 96.3% | 6,568 | Strawhomes MLS data |
| Fraser Valley, all home types | 5.3% | 5.0% | 89.7% | 95.8% | 2,202 | Strawhomes MLS data |
| Fraser Valley, detached | 6.2% | 3.0% | 90.8% | 95.5% | 1,233 | Strawhomes MLS data |
| Fraser Valley, townhouse | 3.0% | 10.2% | 86.8% | 96.9% | 532 | Strawhomes MLS data |
| Fraser Valley, apartment | 5.3% | 4.3% | 90.4% | 95.2% | 437 | Strawhomes MLS data |
- Sold over asking: 6.8 (6.8%)
- Sold at asking: 6.8 (6.8%)
- Sold under asking: 86.4 (86.4%)
96.1%: The median home in both regions sold for this share of its original asking price, May to October 2026. (Strawhomes MLS data, 2026)
Regions follow the regional district map: Surrey, Langley and White Rock are Metro Vancouver; the Fraser Valley is Abbotsford, Chilliwack, Mission and east. The headline number hides how lopsided the market is. For every home that sold over its original asking price, roughly a dozen sold under it. Townhouses were the most likely type to sell exactly at asking (10.1%), which fits a product that is priced off a building's recent sales and leaves little room to argue. Single family detached houses were the least likely to sell at asking (3.2%) and had the deepest typical discount, with a median sale of 95.1% of the original price.
Over-asking sales are small wins, not frenzies. Among sales that did go over, the median premium was 2.3% above the original asking price. If you are working out how much to offer on a house in BC, the base case in this market is an offer below asking, not above it. The gap between asking price and selling price is the number to study before you write one.
Which Cities Have the Most Homes Selling Over Asking? Vancouver Leads at 9.9%, Fraser Valley Homes Trail
Vancouver had the highest share of sales over original asking of any city, 9.9% of 3,536 sales (Strawhomes MLS data, 2026). Richmond (7.9%) and Burnaby (7.4%) followed. Langley (4.1%) and Pitt Meadows (2.4%) were the lowest among cities with 100 or more sales.
| City | Region | Over original ask | At ask | Under ask | Median sale to original ask | Sales | Over ask, May to Oct 2025 | Source |
|---|---|---|---|---|---|---|---|---|
| Vancouver | Metro Vancouver | 9.9% | 6.7% | 83.4% | 96.5% | 3,536 | 12.0% | Strawhomes MLS data |
| Richmond | Metro Vancouver | 7.9% | 5.6% | 86.5% | 95.3% | 1,396 | 9.9% | Strawhomes MLS data |
| Burnaby | Metro Vancouver | 7.4% | 5.7% | 86.9% | 95.8% | 1,471 | 10.7% | Strawhomes MLS data |
| New Westminster | Metro Vancouver | 7.3% | 7.5% | 85.2% | 96.1% | 481 | 7.8% | Strawhomes MLS data |
| Mission | Fraser Valley | 7.0% | 4.3% | 88.7% | 95.1% | 301 | 6.4% | Strawhomes MLS data |
| North Vancouver | Metro Vancouver | 6.9% | 6.1% | 87.0% | 96.6% | 999 | 10.1% | Strawhomes MLS data |
| White Rock | Metro Vancouver | 6.7% | 5.7% | 87.6% | 95.2% | 194 | 4.5% | Strawhomes MLS data |
| Ladner | Metro Vancouver | 6.5% | 8.7% | 84.8% | 95.6% | 46 | not comparable | Strawhomes MLS data |
| Surrey | Metro Vancouver | 6.5% | 5.6% | 87.9% | 95.7% | 2,653 | 7.8% | Strawhomes MLS data |
| Delta | Metro Vancouver | 6.4% | 5.6% | 88.1% | 95.6% | 486 | not comparable | Strawhomes MLS data |
| Agassiz | Fraser Valley | 6.2% | 9.4% | 84.4% | 96.8% | 64 | 3.7% | Strawhomes MLS data |
| Abbotsford | Fraser Valley | 5.9% | 6.9% | 87.2% | 95.9% | 875 | 6.4% | Strawhomes MLS data |
| Coquitlam | Metro Vancouver | 5.9% | 15.9% | 78.1% | 96.9% | 1,061 | 8.4% | Strawhomes MLS data |
| Port Coquitlam | Metro Vancouver | 5.6% | 7.7% | 86.7% | 96.3% | 375 | 6.8% | Strawhomes MLS data |
| Maple Ridge | Metro Vancouver | 4.9% | 6.6% | 88.5% | 96.3% | 608 | 6.2% | Strawhomes MLS data |
| West Vancouver | Metro Vancouver | 4.9% | 2.6% | 92.4% | 92.7% | 304 | 6.3% | Strawhomes MLS data |
| Chilliwack | Fraser Valley | 4.4% | 3.3% | 92.3% | 96.2% | 699 | not comparable | Strawhomes MLS data |
| Port Moody | Metro Vancouver | 4.3% | 9.0% | 86.7% | 97.1% | 279 | 10.6% | Strawhomes MLS data |
| Langley | Metro Vancouver | 4.1% | 9.8% | 86.0% | 96.6% | 1,448 | 6.1% | Strawhomes MLS data |
| Sardis | Fraser Valley | 3.0% | 2.0% | 94.9% | 97.0% | 99 | not comparable | Strawhomes MLS data |
| Pitt Meadows | Metro Vancouver | 2.4% | 1.2% | 96.4% | 96.2% | 167 | 4.8% | Strawhomes MLS data |
| Bowen Island | Metro Vancouver | 2.3% | 0.0% | 97.7% | 94.7% | 44 | fewer than 30 sales | Strawhomes MLS data |
| Hope | Fraser Valley | 2.1% | 0.0% | 97.9% | 94.7% | 47 | 13.0% | Strawhomes MLS data |
| Tsawwassen | Metro Vancouver | 1.2% | 8.4% | 90.4% | 96.0% | 83 | not comparable | Strawhomes MLS data |
| Harrison Hot Springs | Fraser Valley | 0.0% | 5.6% | 94.4% | 96.4% | 36 | fewer than 30 sales | Strawhomes MLS data |
92.7%: West Vancouver's median sale to original asking price, the deepest typical discount of any city with 30 or more sales. (Strawhomes MLS data, 2026)
- Both regions, May to Oct 2025: 8.8%
- Both regions, May to Oct 2026: 6.8%
- Vancouver, May to Oct 2025: 12.0%
- Vancouver, May to Oct 2026: 9.9%
- Surrey, May to Oct 2025: 7.8%
- Surrey, May to Oct 2026: 6.5%
- Burnaby, May to Oct 2025: 10.7%
- Burnaby, May to Oct 2026: 7.4%
- Langley, May to Oct 2025: 6.1%
- Langley, May to Oct 2026: 4.1%
- Richmond, May to Oct 2025: 9.9%
- Richmond, May to Oct 2026: 7.9%
- Coquitlam, May to Oct 2025: 8.4%
- Coquitlam, May to Oct 2026: 5.9%
- North Vancouver, May to Oct 2025: 10.1%
- North Vancouver, May to Oct 2026: 6.9%
The ranking follows the price of entry more than the region. The cities where over-asking sales are most common are the dense, transit-served cores with deep buyer pools: Vancouver, Richmond, Burnaby and New Westminster (7.3%). Langley sells a lot of homes, 1,448 in six months, but only 4.1% of them went over original asking. Buyers there have plenty of new townhouse and condo supply to choose from, and they know it. You can see which pockets of each city still move fast on the Surrey neighbourhood pages and the Burnaby neighbourhood rankings, which use the final list price.
Coquitlam is an outlier for a different reason: 15.9% of its sales closed exactly at the original asking price, more than double the regional rate. Much of that is townhouses: 33.6% of them sold exactly at asking. West Vancouver sits at the other end: the typical home there sold for 92.7% of its original price, so a buyer offering asking is usually overpaying. Almost every city with a year-ago comparison posted a lower over-asking share than in the same months of 2025, with Port Moody (10.6% then, 4.3% now) and Burnaby (10.7% then, 7.4% now) among the biggest drops.
Buying a Home by Type: Which Detached, Townhouse or Apartment Listings Sell Over Asking in Each City?
Vancouver detached houses led every city and type pair at 13.6% over original asking (Strawhomes MLS data, 2026), followed by Vancouver townhouses at 11.9%. Detached houses in Burnaby (5.6%) and Langley (3.6%) sat well below that. Apartment shares ranged from 0.0% in Pitt Meadows to 8.3% in Richmond.
| City | Home type | Over original ask | At ask | Under ask | Median sale to original ask | Median sale price | Sales | Source |
|---|---|---|---|---|---|---|---|---|
| Vancouver | Detached | 13.6% | 2.9% | 83.5% | 95.5% | $2,172,500 | 866 | Strawhomes MLS data |
| Port Moody | Detached | 10.3% | 4.4% | 85.3% | 96.7% | $1,702,900 | 68 | Strawhomes MLS data |
| North Vancouver | Detached | 9.6% | 4.5% | 85.9% | 95.7% | $2,025,000 | 375 | Strawhomes MLS data |
| New Westminster | Detached | 9.3% | 4.1% | 86.6% | 95.9% | $1,365,000 | 97 | Strawhomes MLS data |
| White Rock | Detached | 8.8% | 3.5% | 87.7% | 94.0% | $1,590,000 | 57 | Strawhomes MLS data |
| Agassiz | Detached | 8.7% | 6.5% | 84.8% | 96.0% | $832,500 | 46 | Strawhomes MLS data |
| Mission | Detached | 7.8% | 3.0% | 89.1% | 94.7% | $910,500 | 230 | Strawhomes MLS data |
| Port Coquitlam | Detached | 7.8% | 2.6% | 89.7% | 95.4% | $1,275,000 | 116 | Strawhomes MLS data |
| Coquitlam | Detached | 6.8% | 6.8% | 86.4% | 95.7% | $1,630,000 | 323 | Strawhomes MLS data |
| Delta | Detached | 6.8% | 4.6% | 88.6% | 95.1% | $1,275,000 | 324 | Strawhomes MLS data |
| Richmond | Detached | 6.5% | 0.3% | 93.3% | 93.7% | $1,697,500 | 356 | Strawhomes MLS data |
| Abbotsford | Detached | 6.2% | 2.7% | 91.1% | 95.4% | $1,040,000 | 371 | Strawhomes MLS data |
| Chilliwack | Detached | 6.1% | 3.5% | 90.4% | 96.3% | $860,000 | 395 | Strawhomes MLS data |
| Maple Ridge | Detached | 5.9% | 3.4% | 90.7% | 95.9% | $1,190,000 | 323 | Strawhomes MLS data |
| Burnaby | Detached | 5.6% | 2.1% | 92.4% | 93.8% | $1,800,000 | 288 | Strawhomes MLS data |
| Surrey | Detached | 5.6% | 2.1% | 92.3% | 94.8% | $1,337,250 | 1,076 | Strawhomes MLS data |
| Sardis | Detached | 5.5% | 0.0% | 94.5% | 97.0% | $910,000 | 55 | Strawhomes MLS data |
| West Vancouver | Detached | 5.5% | 2.0% | 92.5% | 91.6% | $2,800,000 | 200 | Strawhomes MLS data |
| Langley | Detached | 3.6% | 4.8% | 91.6% | 95.4% | $1,372,000 | 557 | Strawhomes MLS data |
| Pitt Meadows | Detached | 2.6% | 2.6% | 94.7% | 95.7% | $1,162,500 | 76 | Strawhomes MLS data |
| Hope | Detached | 2.4% | 0.0% | 97.6% | 93.7% | $695,000 | 41 | Strawhomes MLS data |
| Bowen Island | Detached | 2.3% | 0.0% | 97.7% | 94.7% | $1,531,000 | 44 | Strawhomes MLS data |
| Vancouver | Townhouse | 11.9% | 6.8% | 81.3% | 97.0% | $1,382,000 | 739 | Strawhomes MLS data |
| Richmond | Townhouse | 8.6% | 9.1% | 82.3% | 96.1% | $1,000,000 | 362 | Strawhomes MLS data |
| Delta | Townhouse | 8.4% | 6.3% | 85.3% | 96.4% | $970,000 | 95 | Strawhomes MLS data |
| Surrey | Townhouse | 7.8% | 7.7% | 84.6% | 96.8% | $780,000 | 901 | Strawhomes MLS data |
| North Vancouver | Townhouse | 7.7% | 5.1% | 87.2% | 97.1% | $1,347,500 | 195 | Strawhomes MLS data |
| Burnaby | Townhouse | 7.0% | 4.6% | 88.4% | 96.3% | $1,045,500 | 285 | Strawhomes MLS data |
| Langley | Townhouse | 6.0% | 15.5% | 78.5% | 97.5% | $819,900 | 497 | Strawhomes MLS data |
| Mission | Townhouse | 6.0% | 8.0% | 86.0% | 97.2% | $676,750 | 50 | Strawhomes MLS data |
| Coquitlam | Townhouse | 5.3% | 33.6% | 61.1% | 98.2% | $1,049,900 | 265 | Strawhomes MLS data |
| Port Coquitlam | Townhouse | 4.4% | 7.0% | 88.6% | 96.8% | $877,750 | 114 | Strawhomes MLS data |
| Abbotsford | Townhouse | 4.0% | 16.2% | 79.8% | 97.0% | $645,000 | 247 | Strawhomes MLS data |
| Maple Ridge | Townhouse | 3.7% | 10.5% | 85.8% | 96.9% | $719,950 | 162 | Strawhomes MLS data |
| New Westminster | Townhouse | 3.4% | 6.9% | 89.7% | 96.9% | $867,000 | 58 | Strawhomes MLS data |
| Pitt Meadows | Townhouse | 3.4% | 0.0% | 96.6% | 97.1% | $703,000 | 58 | Strawhomes MLS data |
| Port Moody | Townhouse | 3.0% | 7.6% | 89.4% | 97.4% | $1,041,500 | 66 | Strawhomes MLS data |
| Chilliwack | Townhouse | 1.7% | 2.3% | 96.0% | 96.5% | $575,000 | 175 | Strawhomes MLS data |
| Sardis | Townhouse | 0.0% | 6.1% | 93.9% | 97.3% | $590,000 | 33 | Strawhomes MLS data |
| Tsawwassen | Townhouse | 0.0% | 13.9% | 86.1% | 96.6% | $795,000 | 36 | Strawhomes MLS data |
| Richmond | Apartment | 8.3% | 6.5% | 85.3% | 95.5% | $598,950 | 678 | Strawhomes MLS data |
| Burnaby | Apartment | 8.1% | 7.2% | 84.6% | 96.2% | $639,250 | 898 | Strawhomes MLS data |
| Vancouver | Apartment | 7.5% | 8.3% | 84.2% | 96.6% | $740,000 | 1,931 | Strawhomes MLS data |
| Abbotsford | Apartment | 7.4% | 3.9% | 88.7% | 95.1% | $380,000 | 257 | Strawhomes MLS data |
| New Westminster | Apartment | 7.4% | 8.6% | 84.0% | 96.0% | $560,000 | 326 | Strawhomes MLS data |
| Surrey | Apartment | 6.4% | 8.4% | 85.2% | 95.5% | $471,050 | 676 | Strawhomes MLS data |
| Coquitlam | Apartment | 5.7% | 12.3% | 82.0% | 96.8% | $605,000 | 473 | Strawhomes MLS data |
| White Rock | Apartment | 5.6% | 6.3% | 88.1% | 95.5% | $521,500 | 126 | Strawhomes MLS data |
| Port Coquitlam | Apartment | 4.8% | 12.4% | 82.8% | 96.5% | $565,000 | 145 | Strawhomes MLS data |
| West Vancouver | Apartment | 4.8% | 4.8% | 90.5% | 95.1% | $1,247,500 | 84 | Strawhomes MLS data |
| North Vancouver | Apartment | 4.2% | 7.9% | 87.9% | 96.7% | $745,000 | 429 | Strawhomes MLS data |
| Maple Ridge | Apartment | 4.1% | 9.8% | 86.2% | 96.2% | $455,000 | 123 | Strawhomes MLS data |
| Chilliwack | Apartment | 3.1% | 3.9% | 93.0% | 95.2% | $350,000 | 129 | Strawhomes MLS data |
| Langley | Apartment | 2.5% | 9.6% | 87.8% | 96.1% | $499,900 | 394 | Strawhomes MLS data |
| Port Moody | Apartment | 2.1% | 11.7% | 86.2% | 97.3% | $712,000 | 145 | Strawhomes MLS data |
| Delta | Apartment | 1.5% | 9.0% | 89.6% | 95.2% | $570,000 | 67 | Strawhomes MLS data |
| Pitt Meadows | Apartment | 0.0% | 0.0% | 100.0% | 95.7% | $530,000 | 33 | Strawhomes MLS data |
| Tsawwassen | Apartment | 0.0% | 3.0% | 97.0% | 94.3% | $535,000 | 33 | Strawhomes MLS data |
- Vancouver Detached: 13.6%
- Vancouver Townhouse: 11.9%
- Port Moody Detached: 10.3%
- North Vancouver Detached: 9.6%
- New Westminster Detached: 9.3%
- White Rock Detached: 8.8%
- Agassiz Detached: 8.7%
- Reference line, Region average: 6.8%
33.6%: Share of Coquitlam townhouse sales that closed exactly at the original asking price, the highest at-asking share in the region. (Strawhomes MLS data, 2026)
Detached houses split the market in two. In Vancouver, 13.6% of detached sales went over original asking, and North Vancouver (9.6%) was not far behind. In Surrey (5.6%) and Richmond (6.5%), detached houses sold over asking far less often, and Richmond's median detached sale was 93.7% of the original price. The drop in detached prices since the 2022 peak, larger still after inflation, has brought some buyers back to the city core, and the over-asking share is where that shows first.
Townhouses are the most predictable product. Their median sale sits closest to the original price, 97.0% region-wide, and Coquitlam and Langley townhouses sold at exactly the asking price 33.6% and 15.5% of the time. Apartments tell a quieter story: even in Burnaby, where 8.1% of condo sales went over original asking, the median condo still sold for 96.2% of the first price. Use the budget checker below to see these rows filtered to what you can spend.
Does a Price Cut End a Listing's Chance of Selling Over Asking for the Buyer? 0.3% vs 9.2%
Yes, against the original price. 26.5% of homes sold from May to October 2026 had their list price cut first (Strawhomes MLS data, 2026). Of those, 0.3% sold above the original asking price. Of homes that never cut, 9.2% did. A cut home's median sale was 91.4% of its original price.
| Area and home type | Sold after a price cut | Over ask, never cut | Over ask, after a cut | Median sale to original ask, never cut | Median sale to original ask, after a cut | Source |
|---|---|---|---|---|---|---|
| Both regions, all home types | 26.5% | 9.2% | 0.3% | 97.3% | 91.4% | Strawhomes MLS data |
| Both regions, detached | 28.4% | 9.9% | 0.3% | 96.6% | 90.4% | Strawhomes MLS data |
| Both regions, townhouse | 24.3% | 9.2% | 0.4% | 97.8% | 92.8% | Strawhomes MLS data |
| Both regions, apartment | 26.1% | 8.6% | 0.2% | 97.3% | 91.4% | Strawhomes MLS data |
| Metro Vancouver, all home types | 25.3% | 9.3% | 0.3% | 97.2% | 91.4% | Strawhomes MLS data |
| Fraser Valley, all home types | 34.7% | 7.9% | 0.4% | 97.3% | 91.5% | Strawhomes MLS data |
- All homes, Never cut: 9.2%
- All homes, After a cut: 0.3%
- Detached, Never cut: 9.9%
- Detached, After a cut: 0.3%
- Townhouse, Never cut: 9.2%
- Townhouse, After a cut: 0.4%
- Apartment, Never cut: 8.6%
- Apartment, After a cut: 0.2%
91.4%: Median sale price as a share of the original asking price for homes that cut their price before selling, both regions. (Strawhomes MLS data, 2026)
This is the part of the over-asking story that region-wide numbers miss. The bidding war, where it still happens, happens in the first weeks on market at the first price. Once a seller cuts, the buyer pool reads the cut as a signal, and the sale lands well below where the seller started. The Fraser Valley cuts more often (34.7% of sold homes) than Metro Vancouver (25.3%), which is part of why its over-asking share is lower.
For sellers, the lesson is about the first price, not the second. A home priced right at launch has a 9.2% chance of a sale over asking. A home priced too high, then cut, gives up that chance and typically sells for less than the never-cut home would have. Our guides on when to lower the price on a house in BC and on how sellers start a bidding war cover the pricing side in more detail.
Original Asking Price or Final MLS® List Price: Does the Definition Change the Answer?
For how often homes sell over asking, barely: 6.8% against the original price and 6.8% against the final list price (Strawhomes MLS data, 2026). For how far under they sell, it does. The median sale was 96.1% of the original price but 97.0% of the final list price.
| Area and home type | Over original ask | Over final list price | Median sale to original ask | Median sale to final list price | Source |
|---|---|---|---|---|---|
| Both regions, all home types | 6.8% | 6.8% | 96.1% | 97.0% | Strawhomes MLS data |
| Metro Vancouver, all home types | 7.0% | 7.0% | 96.1% | 97.0% | Strawhomes MLS data |
| Fraser Valley, all home types | 5.3% | 5.8% | 95.8% | 97.1% | Strawhomes MLS data |
| Both regions, detached | 7.2% | 7.5% | 95.1% | 96.3% | Strawhomes MLS data |
| Both regions, townhouse | 7.0% | 6.9% | 97.0% | 97.6% | Strawhomes MLS data |
| Both regions, apartment | 6.4% | 6.2% | 96.2% | 97.1% | Strawhomes MLS data |
The two shares match because over-asking sales almost never follow a cut, as the section above shows, so for those homes the original and final prices are the same. The medians differ because a quarter of sales did follow a cut, and measuring them against the reduced price makes the discount look smaller. A seller quoting a "sale-to-list ratio" is usually quoting the final-price version. Our MLS market trends pages and the Coquitlam neighbourhood table use the final list price and the month a sale completed, so their numbers will not match this article's.
For a buyer, the original-price version is the honest one, because it is the number on the listing when you first saw it. If a home first listed at a price and is now cut, the data says the likely sale is closer to 91.4% of the first price than to the new one. When a listing says "sold over asking", it is worth checking which asking price the agent means, and whether a highest and best offer was actually needed.
Are Bidding Wars Coming Back? A Decline From 17.0% in 2025 to 6.6% Over Asking
Not so far. The monthly share of sales over original asking peaked at 17.0% in March 2025 and was 6.6% in October 2026 (Strawhomes MLS data, 2026). For May to October, the share fell from 8.8% in 2025 to 6.8% in 2026. Spring 2026 never produced the usual seasonal jump: March 2026 was 8.6%.
| Month sales went firm | Over original ask | Median sale to original ask | Sales with an original price | Share of sales with an original price | Source |
|---|---|---|---|---|---|
| November 2024 | 14.0% | 97.5% | 1,509 | 59.1% | Strawhomes MLS data |
| December 2024 | 13.2% | 97.4% | 1,508 | 56.1% | Strawhomes MLS data |
| January 2025 | 13.6% | 97.7% | 1,351 | 56.8% | Strawhomes MLS data |
| February 2025 | 15.6% | 98.2% | 1,540 | 57.4% | Strawhomes MLS data |
| March 2025 | 17.0% | 98.2% | 1,985 | 62.9% | Strawhomes MLS data |
| April 2025 | 14.1% | 97.9% | 1,958 | 61.6% | Strawhomes MLS data |
| May 2025 | 13.6% | 97.6% | 2,053 | 61.4% | Strawhomes MLS data |
| June 2025 | 9.5% | 96.8% | 1,987 | 58.2% | Strawhomes MLS data |
| July 2025 | 7.8% | 96.7% | 1,984 | 57.6% | Strawhomes MLS data |
| August 2025 | 6.8% | 96.5% | 2,051 | 72.2% | Strawhomes MLS data |
| September 2025 | 8.3% | 96.5% | 2,557 | 91.2% | Strawhomes MLS data |
| October 2025 | 7.7% | 96.6% | 3,065 | 92.6% | Strawhomes MLS data |
| November 2025 | 7.1% | 95.9% | 2,170 | 79.3% | Strawhomes MLS data |
| December 2025 | 6.2% | 95.3% | 1,265 | 53.1% | Strawhomes MLS data |
| January 2026 | 7.1% | 95.9% | 860 | 50.4% | Strawhomes MLS data |
| February 2026 | 8.7% | 97.0% | 1,187 | 48.8% | Strawhomes MLS data |
| March 2026 | 8.6% | 96.6% | 1,533 | 51.6% | Strawhomes MLS data |
| April 2026 | 7.9% | 96.6% | 2,860 | 89.9% | Strawhomes MLS data |
| May 2026 | 7.7% | 96.4% | 3,155 | 96.9% | Strawhomes MLS data |
| June 2026 | 7.4% | 96.3% | 3,423 | 97.9% | Strawhomes MLS data |
| July 2026 | 6.7% | 96.0% | 3,031 | 98.1% | Strawhomes MLS data |
| August 2026 | 5.9% | 95.9% | 2,724 | 98.7% | Strawhomes MLS data |
| September 2026 | 6.2% | 95.7% | 2,570 | 98.8% | Strawhomes MLS data |
| October 2026 | 6.6% | 96.0% | 2,948 | 99.3% | Strawhomes MLS data |
- November 2024: 14.0%
- December 2024: 13.2%
- January 2025: 13.6%
- February 2025: 15.6%
- March 2025: 17.0%
- April 2025: 14.1%
- May 2025: 13.6%
- June 2025: 9.5%
- July 2025: 7.8%
- August 2025: 6.8%
- September 2025: 8.3%
- October 2025: 7.7%
- November 2025: 7.1%
- December 2025: 6.2%
- January 2026: 7.1%
- February 2026: 8.7%
- March 2026: 8.6%
- April 2026: 7.9%
- May 2026: 7.7%
- June 2026: 7.4%
- July 2026: 6.7%
- August 2026: 5.9%
- September 2026: 6.2%
- October 2026: 6.6%
13.4%: Greater Vancouver REALTORS' October 2026 sales-to-active listings ratio, close to the line where prices start to slide. (Greater Vancouver REALTORS, October 2026 news release, 2026)
The board numbers explain why. Greater Vancouver REALTORS put the October 2026 sales-to-active listings ratio at 13.4% (Greater Vancouver REALTORS, October 2026 news release, 2026), and say prices tend to face downward pressure when it stays below 12% and upward pressure above 20%. For detached homes it was 11.6%. The Fraser Valley board reported 11% (Fraser Valley Real Estate Board, October 2026 news release, 2026), which it calls a buyer's market. Over-asking sales need a seller's market, and neither region is close to one.
Read the earlier months with care. Before April 2026, part of each month's firm sales carries no original list price in our data (the coverage column), so those months rest on smaller samples than the recent ones. The direction is clear all the same: in the 2025 spring market, roughly one sale in six went over original asking; by late 2026 it was about one in fifteen. Track your own city month by month on the Langley neighbourhood pages and the other city pages, which update monthly.
Budget Checker: Where Do Homes at Your Price Sell Over Asking?
Budget Checker: Where Do Homes at Your Price Sell Over Asking?
Enter a budget to see the cities and home types whose median sale price from May to October 2026 is at or below it, with how often those homes sold over, at or under their original asking price. Cells with fewer than 30 sales are left out.
| City | Median sale price | Home type | Over original ask | At ask | Under ask | Median sale to original ask | Sales |
|---|---|---|---|---|---|---|---|
| Hope (Fraser Valley) | $695,000 | Detached | 2.4% | 0% | 97.6% | 93.7% | 41 |
| Agassiz (Fraser Valley) | $832,500 | Detached | 8.7% | 6.5% | 84.8% | 96% | 46 |
| Chilliwack (Fraser Valley) | $860,000 | Detached | 6.1% | 3.5% | 90.4% | 96.3% | 395 |
| Sardis (Fraser Valley) | $910,000 | Detached | 5.5% | 0% | 94.5% | 97% | 55 |
| Mission (Fraser Valley) | $910,500 | Detached | 7.8% | 3% | 89.1% | 94.7% | 230 |
| Abbotsford (Fraser Valley) | $1,040,000 | Detached | 6.2% | 2.7% | 91.1% | 95.4% | 371 |
| Pitt Meadows (Metro Vancouver) | $1,162,500 | Detached | 2.6% | 2.6% | 94.7% | 95.7% | 76 |
| Maple Ridge (Metro Vancouver) | $1,190,000 | Detached | 5.9% | 3.4% | 90.7% | 95.9% | 323 |
| Delta (Metro Vancouver) | $1,275,000 | Detached | 6.8% | 4.6% | 88.6% | 95.1% | 324 |
| Port Coquitlam (Metro Vancouver) | $1,275,000 | Detached | 7.8% | 2.6% | 89.7% | 95.4% | 116 |
| Surrey (Metro Vancouver) | $1,337,250 | Detached | 5.6% | 2.1% | 92.3% | 94.8% | 1,076 |
| New Westminster (Metro Vancouver) | $1,365,000 | Detached | 9.3% | 4.1% | 86.6% | 95.9% | 97 |
| Langley (Metro Vancouver) | $1,372,000 | Detached | 3.6% | 4.8% | 91.6% | 95.4% | 557 |
| Bowen Island (Metro Vancouver) | $1,531,000 | Detached | 2.3% | 0% | 97.7% | 94.7% | 44 |
| White Rock (Metro Vancouver) | $1,590,000 | Detached | 8.8% | 3.5% | 87.7% | 94% | 57 |
| Coquitlam (Metro Vancouver) | $1,630,000 | Detached | 6.8% | 6.8% | 86.4% | 95.7% | 323 |
| Richmond (Metro Vancouver) | $1,697,500 | Detached | 6.5% | 0.3% | 93.3% | 93.7% | 356 |
| Port Moody (Metro Vancouver) | $1,702,900 | Detached | 10.3% | 4.4% | 85.3% | 96.7% | 68 |
| Burnaby (Metro Vancouver) | $1,800,000 | Detached | 5.6% | 2.1% | 92.4% | 93.8% | 288 |
| North Vancouver (Metro Vancouver) | $2,025,000 | Detached | 9.6% | 4.5% | 85.9% | 95.7% | 375 |
| Vancouver (Metro Vancouver) | $2,172,500 | Detached | 13.6% | 2.9% | 83.5% | 95.5% | 866 |
| West Vancouver (Metro Vancouver) | $2,800,000 | Detached | 5.5% | 2% | 92.5% | 91.6% | 200 |
| Chilliwack (Fraser Valley) | $575,000 | Townhouse | 1.7% | 2.3% | 96% | 96.5% | 175 |
| Sardis (Fraser Valley) | $590,000 | Townhouse | 0% | 6.1% | 93.9% | 97.3% | 33 |
| Abbotsford (Fraser Valley) | $645,000 | Townhouse | 4% | 16.2% | 79.8% | 97% | 247 |
| Mission (Fraser Valley) | $676,750 | Townhouse | 6% | 8% | 86% | 97.2% | 50 |
| Pitt Meadows (Metro Vancouver) | $703,000 | Townhouse | 3.4% | 0% | 96.6% | 97.1% | 58 |
| Maple Ridge (Metro Vancouver) | $719,950 | Townhouse | 3.7% | 10.5% | 85.8% | 96.9% | 162 |
| Surrey (Metro Vancouver) | $780,000 | Townhouse | 7.8% | 7.7% | 84.6% | 96.8% | 901 |
| Tsawwassen (Metro Vancouver) | $795,000 | Townhouse | 0% | 13.9% | 86.1% | 96.6% | 36 |
| Langley (Metro Vancouver) | $819,900 | Townhouse | 6% | 15.5% | 78.5% | 97.5% | 497 |
| New Westminster (Metro Vancouver) | $867,000 | Townhouse | 3.4% | 6.9% | 89.7% | 96.9% | 58 |
| Port Coquitlam (Metro Vancouver) | $877,750 | Townhouse | 4.4% | 7% | 88.6% | 96.8% | 114 |
| Delta (Metro Vancouver) | $970,000 | Townhouse | 8.4% | 6.3% | 85.3% | 96.4% | 95 |
| Richmond (Metro Vancouver) | $1,000,000 | Townhouse | 8.6% | 9.1% | 82.3% | 96.1% | 362 |
| Port Moody (Metro Vancouver) | $1,041,500 | Townhouse | 3% | 7.6% | 89.4% | 97.4% | 66 |
| Burnaby (Metro Vancouver) | $1,045,500 | Townhouse | 7% | 4.6% | 88.4% | 96.3% | 285 |
| Coquitlam (Metro Vancouver) | $1,049,900 | Townhouse | 5.3% | 33.6% | 61.1% | 98.2% | 265 |
| North Vancouver (Metro Vancouver) | $1,347,500 | Townhouse | 7.7% | 5.1% | 87.2% | 97.1% | 195 |
| Vancouver (Metro Vancouver) | $1,382,000 | Townhouse | 11.9% | 6.8% | 81.3% | 97% | 739 |
| Chilliwack (Fraser Valley) | $350,000 | Apartment | 3.1% | 3.9% | 93% | 95.2% | 129 |
| Abbotsford (Fraser Valley) | $380,000 | Apartment | 7.4% | 3.9% | 88.7% | 95.1% | 257 |
| Maple Ridge (Metro Vancouver) | $455,000 | Apartment | 4.1% | 9.8% | 86.2% | 96.2% | 123 |
| Surrey (Metro Vancouver) | $471,050 | Apartment | 6.4% | 8.4% | 85.2% | 95.5% | 676 |
| Langley (Metro Vancouver) | $499,900 | Apartment | 2.5% | 9.6% | 87.8% | 96.1% | 394 |
| White Rock (Metro Vancouver) | $521,500 | Apartment | 5.6% | 6.3% | 88.1% | 95.5% | 126 |
| Pitt Meadows (Metro Vancouver) | $530,000 | Apartment | 0% | 0% | 100% | 95.7% | 33 |
| Tsawwassen (Metro Vancouver) | $535,000 | Apartment | 0% | 3% | 97% | 94.3% | 33 |
| New Westminster (Metro Vancouver) | $560,000 | Apartment | 7.4% | 8.6% | 84% | 96% | 326 |
| Port Coquitlam (Metro Vancouver) | $565,000 | Apartment | 4.8% | 12.4% | 82.8% | 96.5% | 145 |
| Delta (Metro Vancouver) | $570,000 | Apartment | 1.5% | 9% | 89.6% | 95.2% | 67 |
| Richmond (Metro Vancouver) | $598,950 | Apartment | 8.3% | 6.5% | 85.3% | 95.5% | 678 |
| Coquitlam (Metro Vancouver) | $605,000 | Apartment | 5.7% | 12.3% | 82% | 96.8% | 473 |
| Burnaby (Metro Vancouver) | $639,250 | Apartment | 8.1% | 7.2% | 84.6% | 96.2% | 898 |
| Port Moody (Metro Vancouver) | $712,000 | Apartment | 2.1% | 11.7% | 86.2% | 97.3% | 145 |
| Vancouver (Metro Vancouver) | $740,000 | Apartment | 7.5% | 8.3% | 84.2% | 96.6% | 1,931 |
| North Vancouver (Metro Vancouver) | $745,000 | Apartment | 4.2% | 7.9% | 87.9% | 96.7% | 429 |
| West Vancouver (Metro Vancouver) | $1,247,500 | Apartment | 4.8% | 4.8% | 90.5% | 95.1% | 84 |
Fraser Valley Real Estate Board and GVR Data: High Inventory, Composite Benchmark Price and Market Outlook
The Fraser Valley Real Estate Board, whose area includes Surrey, Langley, White Rock and North Delta, recorded 1,051 sales on its Multiple Listing Service® (MLS®) in October 2026 (Fraser Valley Real Estate Board, October 2026 news release, 2026), with overall inventory softening to 9,164 active listings. The composite benchmark price for a typical Fraser Valley home was $860,000, a decrease of 6.4% from a year earlier. The average number of days to sell a single-family detached home was 50 days, against 44 days for a condo and 37 days for a townhome, and the board's overall sales-to-active listings ratio of 11% keeps the Fraser Valley in buyer's market territory.
In Metro Vancouver, Greater Vancouver REALTORS counted 2,024 sales in October 2026, a decrease of 10.2% from October 2025, with 15,688 properties listed for sale (Greater Vancouver REALTORS, October 2026 news release, 2026). Both boards flagged mortgage rates after an October Bank of Canada rate hike, so buyers weigh borrowing costs against prices that have eased. High inventory in both board areas gives buyers the leverage.
Frequently Asked Questions
What percentage of homes sell over asking in Metro Vancouver?
In Metro Vancouver, 7.0% of home sales that went firm from May to October 2026 closed above the original asking price and 85.9% closed below it. The median sale was 96.1% of the original asking price, based on 15,649 sales in Strawhomes MLS data. (Strawhomes MLS data, 2026)
Which city has the most homes selling over asking?
Among Metro Vancouver and Fraser Valley cities with 30 or more sales from May to October 2026, Vancouver led with 9.9% of sales over original asking. By city and home type, Vancouver detached houses led at 13.6%. Among cities with 100 or more sales, Pitt Meadows had the lowest share, 2.4%, per Strawhomes MLS data. (Strawhomes MLS data, 2026)
Do homes in the Fraser Valley sell over asking?
Rarely. In the Fraser Valley regional district (Abbotsford, Chilliwack, Mission and nearby towns), 5.3% of sales from May to October 2026 closed above original asking and the median sale was 95.8% of it. 34.7% of sold homes had a price cut first, per Strawhomes MLS data. (Strawhomes MLS data, 2026)
Can a home sell over asking after a price reduction?
Almost never against the original price. Across both regions from May to October 2026, 0.3% of homes that cut their price sold above the original asking price, against 9.2% of homes that never cut. A cut home's median sale was 91.4% of its original price, per Strawhomes MLS data. (Strawhomes MLS data, 2026)
How much over asking do homes sell for in Vancouver?
Not much. Among Metro Vancouver and Fraser Valley sales that closed over original asking from May to October 2026, the median premium was 2.3% above the original price. Only 6.8% of all sales went over, so the typical buyer paid 96.1% of asking, per Strawhomes MLS data. (Strawhomes MLS data, 2026)
Are bidding wars coming back in Vancouver?
Not yet. The share of sales over original asking fell from 8.8% in May to October 2025 to 6.8% in the same months of 2026, per Strawhomes MLS data. Greater Vancouver REALTORS put the October 2026 sales-to-active ratio at 13.4%, near the 12% line below which prices face downward pressure. (Strawhomes MLS data; Greater Vancouver REALTORS, 2026)
Should a buyer or investor offer over asking for Fraser Valley homes?
The data says it is rarely needed. In the Fraser Valley regional district, 5.3% of sales from May to October 2026 closed above original asking and the median sale was 95.8% of it. Across both regions, homes that cut their price first sold for a median 91.4% of the original price, per Strawhomes MLS data. (Strawhomes MLS data, 2026)
How long does it take to sell a home in the Fraser Valley real estate market?
In October 2026 the average number of days to sell was 50 days for a single-family detached home, 44 days for a condo and 37 days for a townhome, according to the Fraser Valley Real Estate Board, whose area also includes Surrey, Langley, White Rock and North Delta. The board's sales-to-active listings ratio was 11%, which it describes as a buyer's market. (Fraser Valley Real Estate Board, October 2026 news release, 2026)
Methodology
Sales: Strawhomes MLS data for residential sales (detached, townhouse, apartment; land, residential income and the 'Other' sub type excluded) that went firm between May 1 and October 31, 2026, using the date the deal went firm (Bridge PendingTimestamp), Closed and Pending status, sale price of $50,000 or more. This is the same sale set and city basis as our /mls/ city trends pages: their monthly sales counts by city and type for May to October 2026 match ours exactly when the few sales under $50,000, which those counts keep, are included. Detached includes duplexes, triplexes, fourplexes and manufactured homes; townhouse includes row houses and half duplexes; apartment is apartment/condo. City is the listing's city, as on our trends pages, so Sardis, Ladner and Tsawwassen are their own rows; Langley combines the City and Township of Langley. Because older listings in those areas switch between the sub-area and Chilliwack or Delta, their year-ago cells are marked not comparable. Metro Vancouver and Fraser Valley follow the regional district boundaries, so Surrey, Langley and White Rock count in the Metro Vancouver Regional District even though they trade on the Fraser Valley board, while Abbotsford, Chilliwack, Sardis, Mission, Agassiz, Hope and Harrison Hot Springs count as Fraser Valley; Squamish, Whistler and the Sunshine Coast are out. Over, at and under asking compare the sale price with the listing's original list price; the final list price is the list price at the time of sale. A home with a lower final price than original price counts as a price cut. Original list price is per MLS listing, so a home withdrawn and relisted starts again with a new original price, and this measure understates how far some sellers came down. 98.2% of the May to October 2026 sales carry an original list price; the same months of 2025 carry 71.5%, and some months before April 2026 carry about half. A check of the 2025 window found the sales with and without an original price had similar median sale prices, and weighting each 2025 month by its total sales gives 9.0% over asking against the pooled 8.8%, so the direction holds; the year-ago comparison is still the less certain one. Every reported cell has 30 or more sales; smaller ones are left out. No individual listing or seller is identified. Board figures are from the Greater Vancouver REALTORS and Fraser Valley Real Estate Board October 2026 statistics packages, confirmed against the PDFs' text. Recency sweep (Reddit, YouTube, web, last 30 days) found no newer over-asking data for the region; the angle pass was done by hand. This is a snapshot of real estate trends in two regions of British Columbia, not a forecast. Images were generated with GPT Image 2 from the figures in this article.
Sources consulted: 9
Sources cited: 3
Data freshness: current year: 3, last year: 0, older: 0
Data range: 2024-11-01 to 2026-10-31
Research date: 2026-11-18
Update schedule: Twice a year
Limitations: Original list price is per MLS listing: a home taken off the market and relisted starts a new listing with a new original price. Before April 2026 a share of firm sales carries no original list price in our data (coverage shown per month).
Sources & References
- Strawhomes MLS data. "Strawhomes MLS data: sales that went firm May 1 to October 31, 2026, with original and final list prices." strawhomes.com/mls/trends/. Accessed 2026-11-18.
- Greater Vancouver REALTORS, October 2026 news release. "Buyers and sellers step back in October (October 2026 statistics package)." members.gvrealtors.ca/news/GVR-Stats-Package-October-2026.pdf. Accessed 2026-11-18.
- Fraser Valley Real Estate Board, October 2026 news release. "Fraser Valley Housing Market Statistics, October 2026." fvreb.bc.ca/statistics/Package202610.pdf. Accessed 2026-11-18.

Let's Chat! Looking for a REALTOR® who can exceed your expectations? Look no further than Richard Morrison! His mission is to serve without limit & provide solutions that cater to your core needs.
• 20+ Years of Experience
• Medallion Member
• RE/MAX Hall of Fame

Latest Properties Added
| Property | Size | Price | Date Listed |
|---|---|---|---|
| 3 - 5402 Vista Court, West Vancouver | 3,038 sqft | $2,898,000 | Nov 17, 2026 |
| 5579 136b Street, Surrey | 7,541 sqft | $4,699,000 | Nov 16, 2026 |
| 8069 124 Street, Surrey | 3,457 sqft | $1,738,000 | Nov 16, 2026 |
| 300 - 1226 Hamilton Street, Vancouver | 612 sqft | $597,000 | Nov 17, 2026 |
| 20218 42a Avenue, Langley | 2,130 sqft | $1,474,999 | Nov 17, 2026 |
| 78 - 10311 River Drive, Richmond | 1,213 sqft | $929,000 | Nov 16, 2026 |
| 1934 Goleta Drive, Burnaby | 1,273 sqft | $649,900 | Nov 17, 2026 |
| 9015 155a Street, Surrey | 1,575 sqft | $1,000,000 | Nov 16, 2026 |
| 307 - 8820 No. 1 Road, Richmond | 972 sqft | $429,800 | Nov 17, 2026 |
| 301 - 789 Jervis Street Street, Vancouver | 1,086 sqft | $1,049,000 | Nov 16, 2026 |
| 2 - 7085 St. George Street, Vancouver | 1,044 sqft | $978,800 | Nov 18, 2026 |
| 19685 74 Avenue, Langley | 3,132 sqft | $1,399,800 | Nov 18, 2026 |
Start your search with Richard Morrison, Top Award Winning Vancouver Realtor
Contact Richard Morrison Top Vancouver Realtor today to find a Vancouver houses for sale and Vancouver condos for sale. Also check out Burnaby houses for sale or maybe Burnaby condos for sale. If you prefer North Shore, take a look at our listings in North Vancouver houses for sale and North Vancouver condos for sale.