Price Cuts by City: How Many Metro Vancouver and Fraser Valley Listings Cut Their Price (2026)
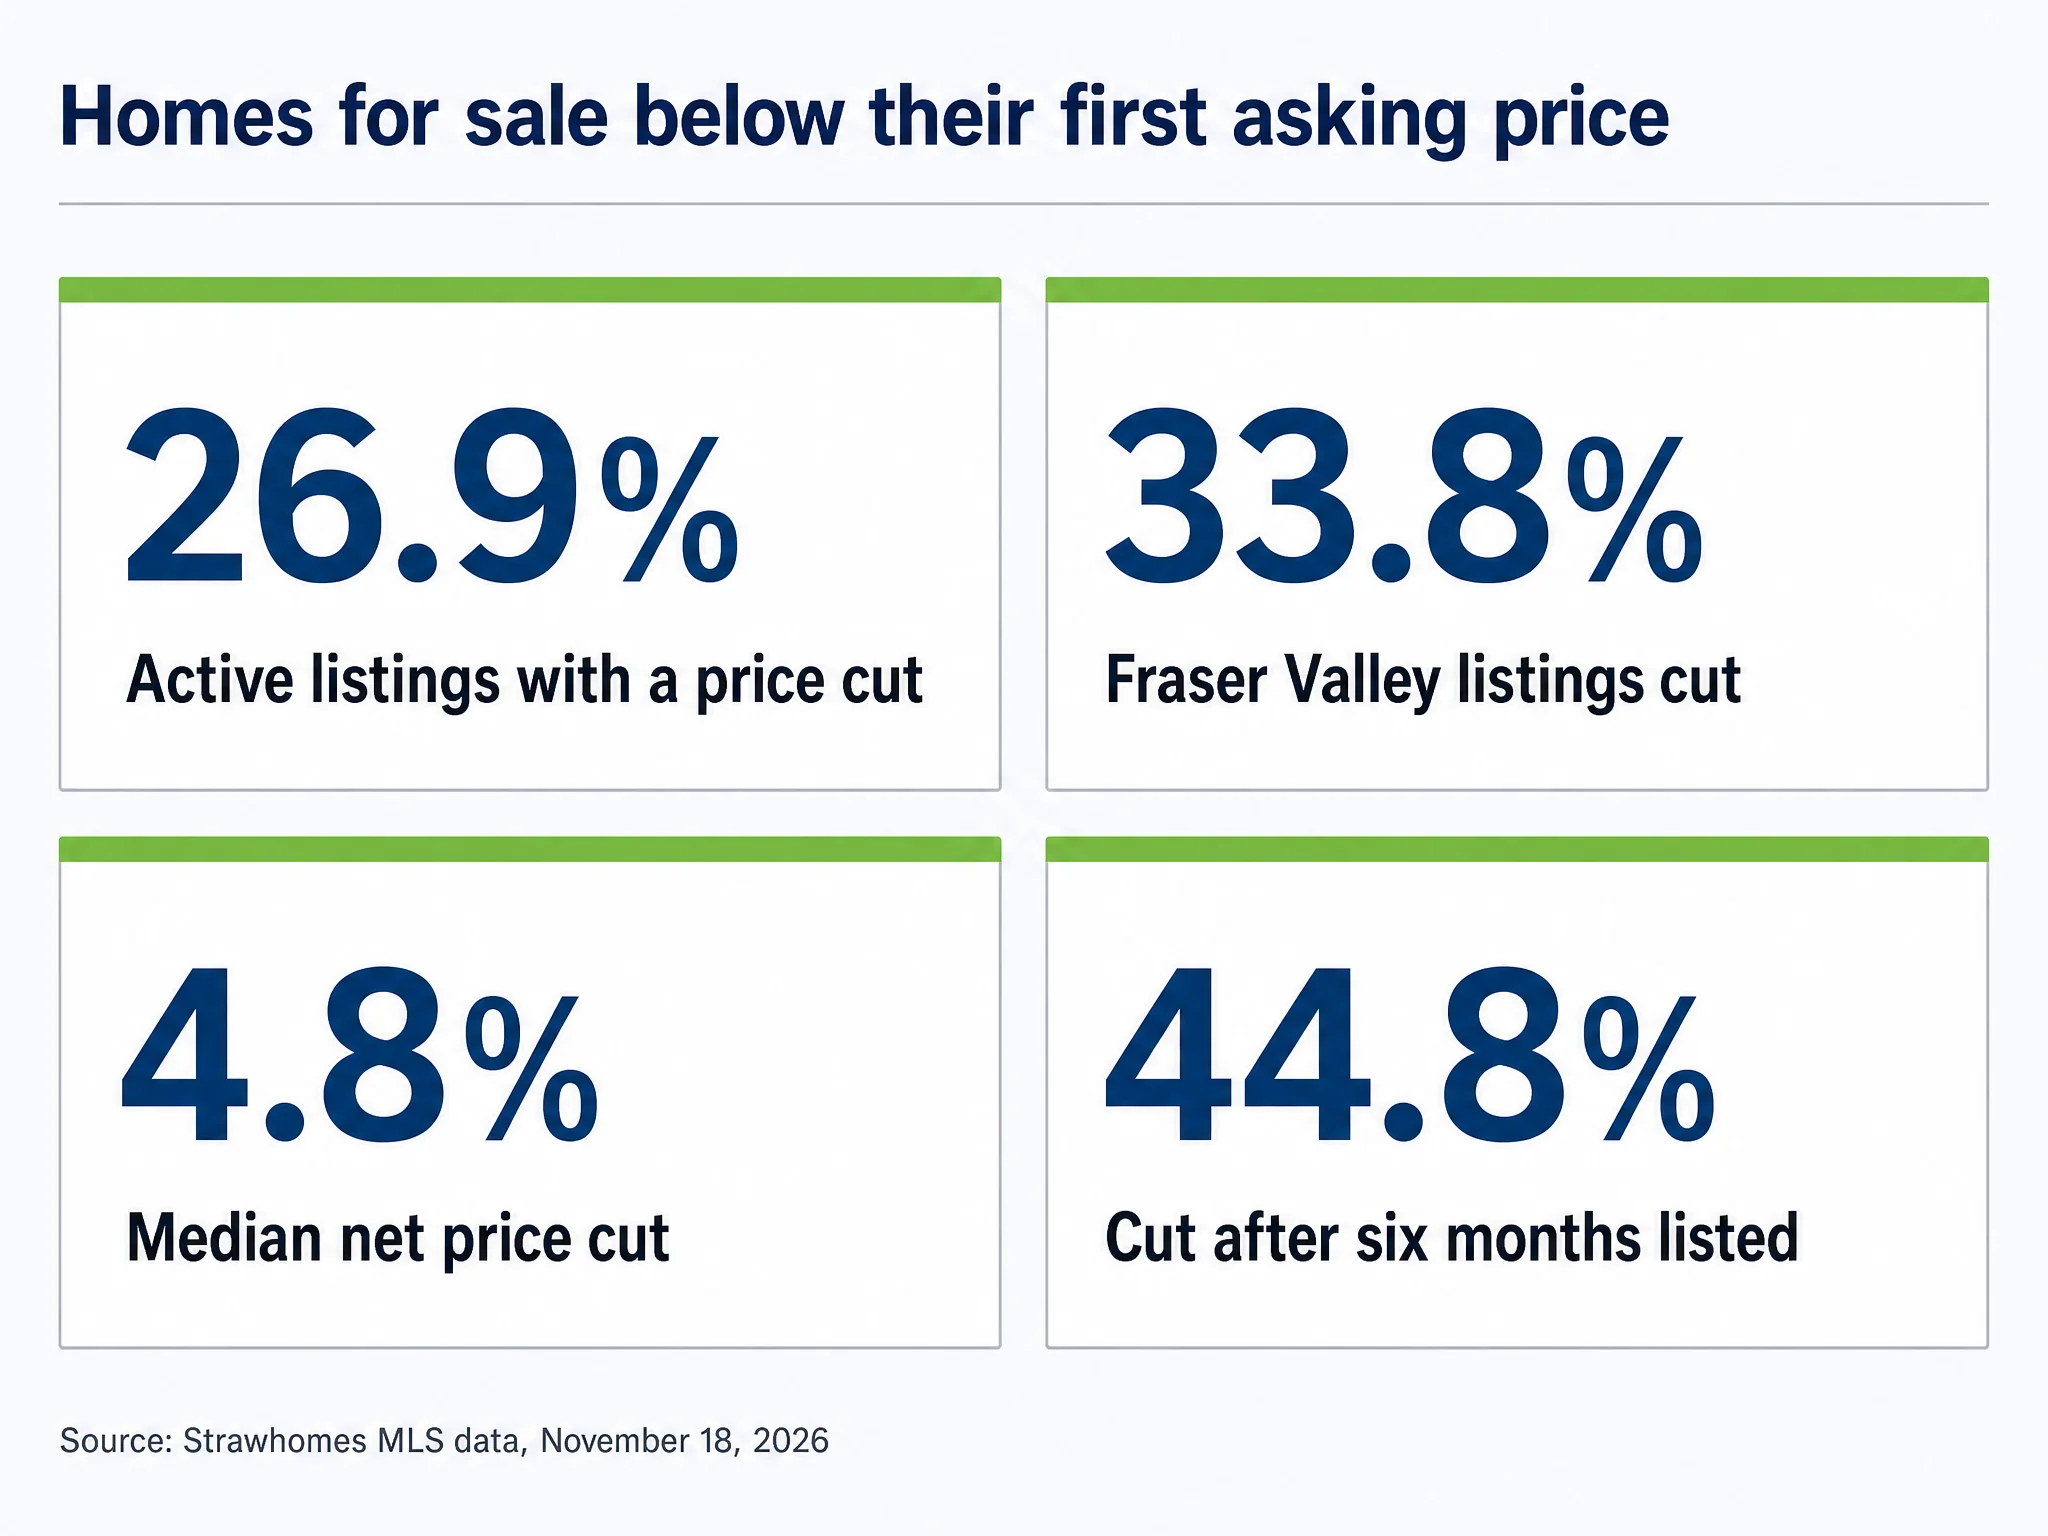
26.9%: 26.9% of the 21,457 homes for sale in Metro Vancouver and the Fraser Valley on November 18, 2026 were listed below their original asking price. Source: Strawhomes MLS data, active listings, November 18, 2026 (2026)
Key Takeaways
- 33.8% of Fraser Valley homes for sale carry a net price cut, against 26.0% in Metro Vancouver. (Strawhomes MLS data, active listings, November 18, 2026, 2026)
- 4.8% is the median net price cut, about $49,000, among listings that have cut. (Strawhomes MLS data, active listings, November 18, 2026, 2026)
- 44.8% of listings on the market 181 days or more have cut their price, against 5.2% in the first 30 days. (Strawhomes MLS data, active listings, November 18, 2026, 2026)
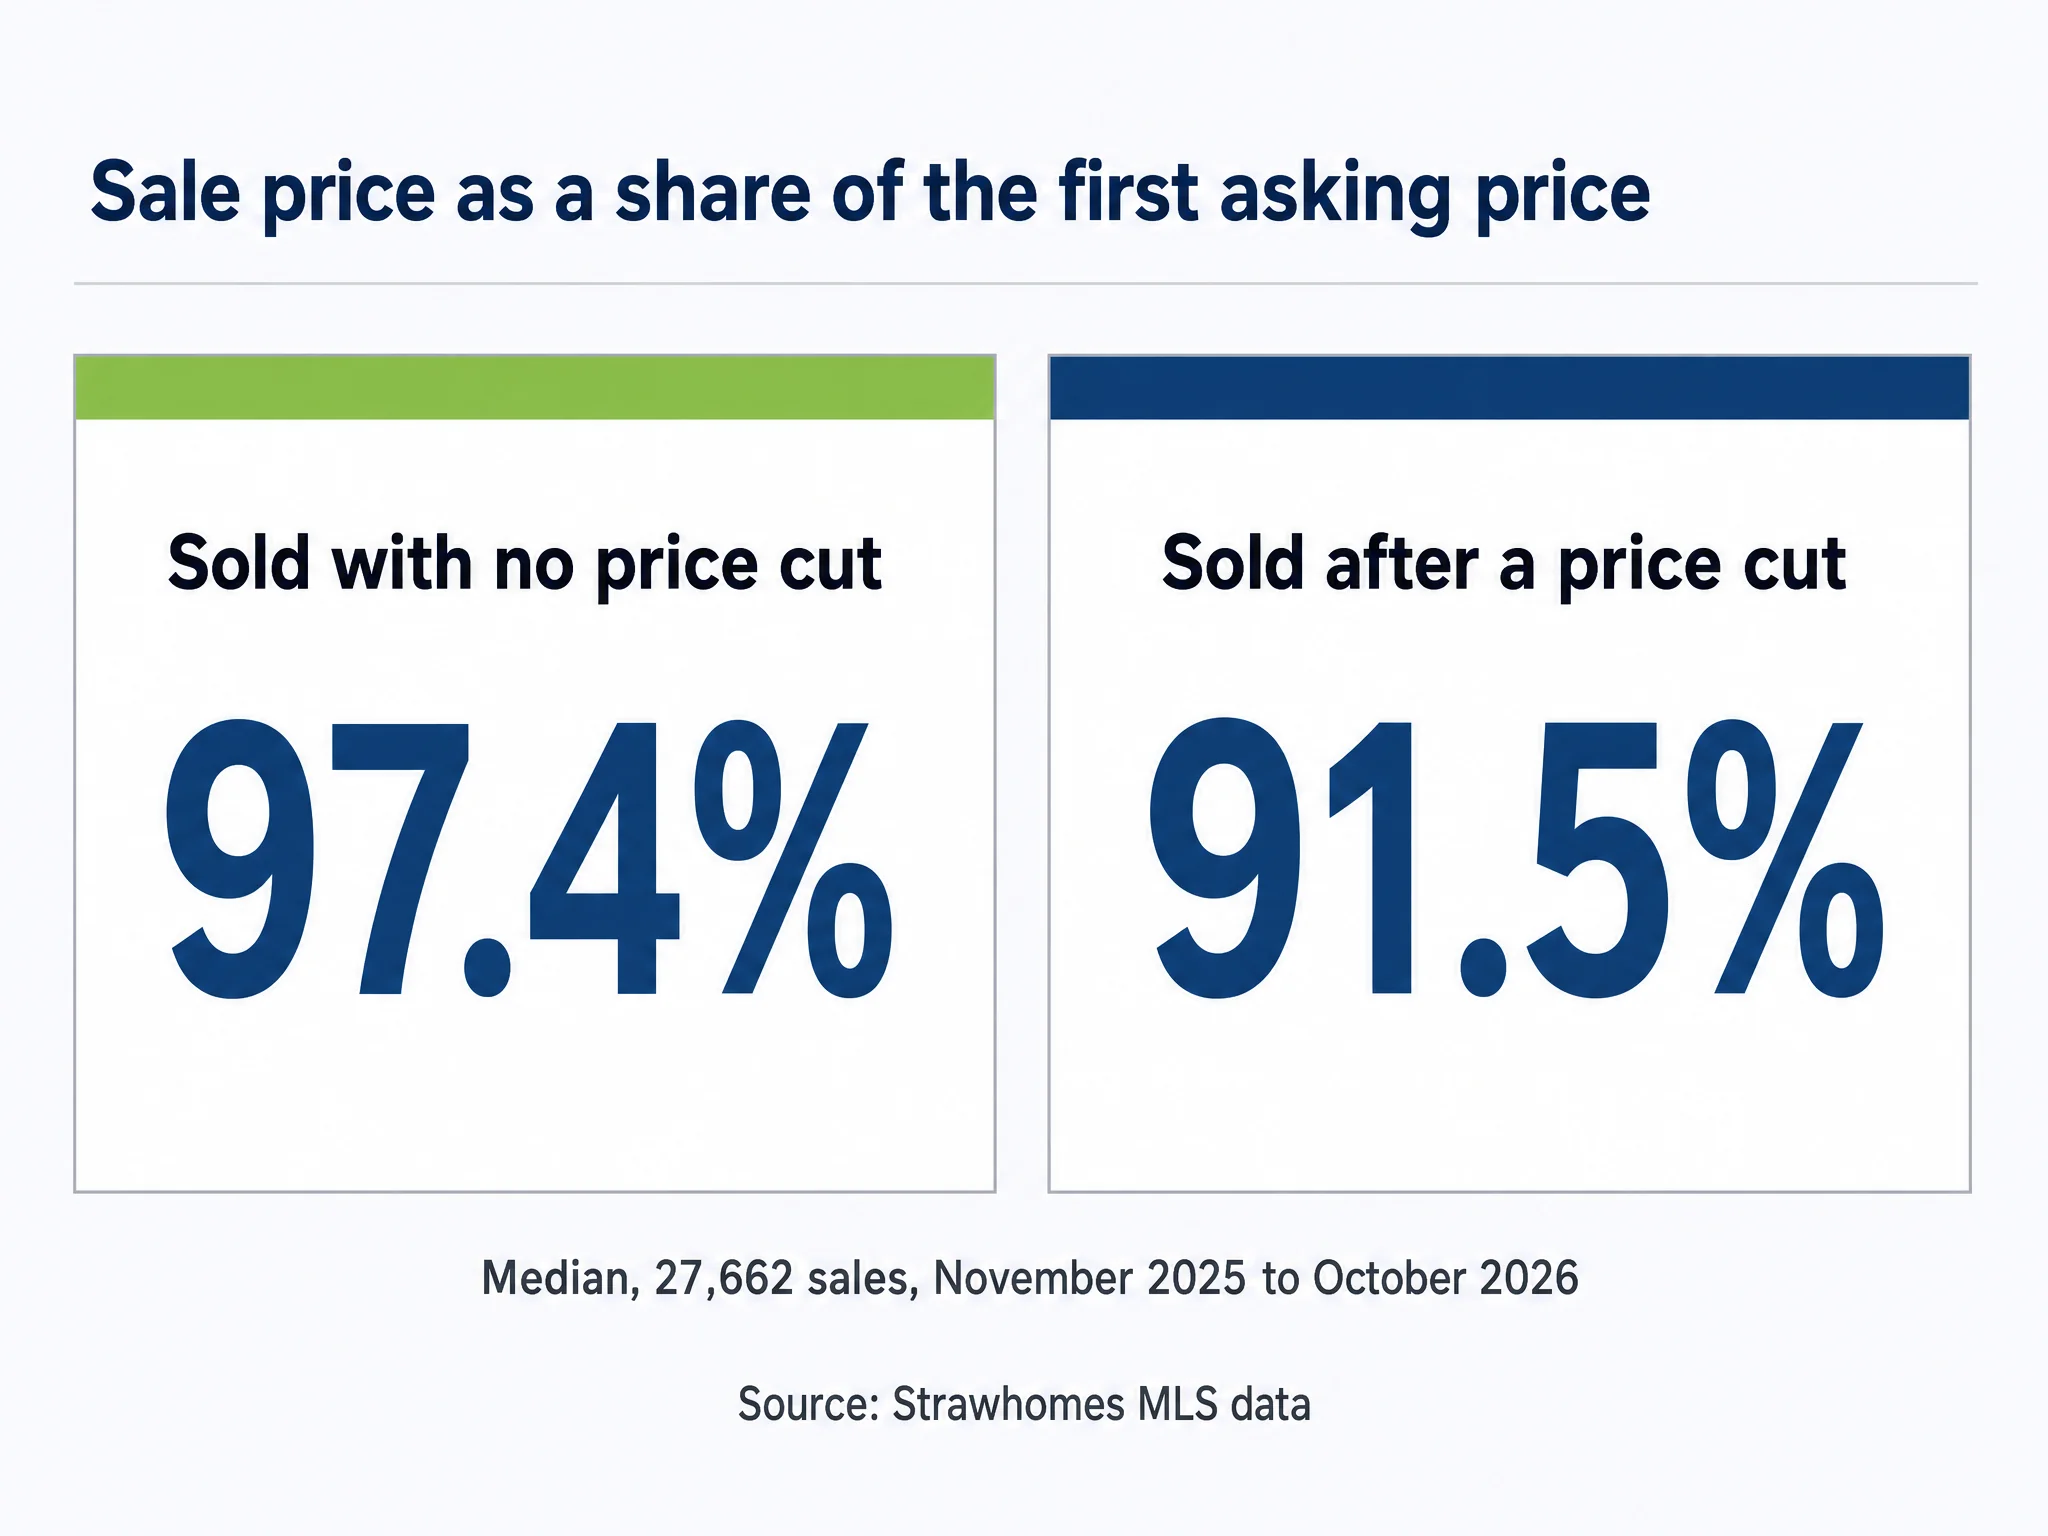
- 91.5% of the original asking price is what homes that cut before selling sold for (median), against 97.4% for homes that never cut. (Strawhomes MLS sold data, November 2025 to October 2026, 2026)
- 38.2% of Chilliwack listings have cut, the highest share of the larger cities; West Vancouver is lowest at 15.7%. (Strawhomes MLS data, active listings, November 18, 2026, 2026)
- 28.6% of townhouses for sale have cut, the highest of the three home types (houses 26.5%, condos 27.6%). (Strawhomes MLS data, active listings, November 18, 2026, 2026)
More than one in four homes for sale in Metro Vancouver and the Fraser Valley is now listed below its original asking price. On November 18, 2026, 5,781 of 21,457 active residential listings carried a net price cut, a share of 26.9% (Strawhomes MLS data, active listings, November 18, 2026, 2026). The median net cut was 4.8%, or $49,000.
The Fraser Valley cuts more often: 33.8% of its listings are below their first price, against 26.0% in Metro Vancouver. City by city the share runs from 40.0% in Cultus Lake (30 listings) and 38.2% in Chilliwack to 11.1% on Bowen Island. Below we break the count down by city, home type, time on the market and price across Metro Vancouver, then check what the homes that cut actually sold for.
If you are asking whether your own asking price is too high, the pattern matters more than any single city. Our guide on how to know when to lower the price on a house in BC covers the warning signs; this article puts numbers on how often sellers here end up doing it, and how much it costs them.
Which Cities Have the Most Price Cuts? Surrey, Langley, Chilliwack and Every City in the Vancouver Area
Cultus Lake (40.0%, 30 listings), Chilliwack (38.2%), Hope (36.1%) and Maple Ridge (35.7%) have the highest shares of listings with a price cut (Strawhomes MLS data, active listings, November 18, 2026, 2026). West Vancouver (15.7%) and Bowen Island have the lowest. The table covers all 25 cities with at least 30 active listings.
- Chilliwack: 38.2%
- Maple Ridge: 35.7%
- New Westminster: 32.2%
- Abbotsford: 29.7%
- Delta: 29.5%
- Langley: 29.0%
- Burnaby: 28.6%
- Surrey: 27.0%
- Coquitlam: 26.6%
- Richmond: 23.9%
- North Vancouver: 22.5%
- Vancouver: 22.0%
- West Vancouver: 15.7%
- Reference line, All listings, both regions: 26.9%
35.7%: Maple Ridge: the highest share of listings with a price cut in Metro Vancouver. (Strawhomes MLS data, active listings, November 18, 2026, 2026)
The Fraser Valley and the eastern suburbs cut most. Chilliwack has 898 active listings and 38.2% of them are below their first price, and Mission (35.2%) and Maple Ridge sit close behind. These are also among the markets with the biggest benchmark price falls since 2022; our report on home prices against the 2022 peak shows the same towns at the bottom of the benchmark table. For month-by-month sales in one of them, see the Chilliwack market report.
The core cities cut less often, but cut more dollars. Vancouver has 4,380 listings and only 22.0% are below their original price, yet the median Vancouver cut is $60,000 (5.2%). West Vancouver sellers cut least often (15.7%) but by a median $200,000, the largest dollar cut in the table, in one of Canada's most expensive housing markets. Richmond (23.9%), North Vancouver (22.5%) and Burnaby (28.6%) sit in between, and Surrey is at 27.0%.
Detached Home, Townhouse or Condo: Which Property Types Have the Most Price Reductions?
Townhouses cut most often: 28.6% of active townhouse listings are below their original price, against 26.5% for houses and 27.6% for condos (Strawhomes MLS data, active listings, November 18, 2026, 2026). In the Fraser Valley the townhouse share reaches 36.1%.
| Region and type | Active listings | Share with a price cut | Median net cut | Median net cut ($) | Source |
|---|---|---|---|---|---|
| Metro Vancouver, houses | 7,193 | 24.7% | 5.6% | $100,000 | Strawhomes MLS data, active listings, November 18, 2026 |
| Metro Vancouver, townhouses | 2,962 | 27.3% | 3.9% | $35,000 | Strawhomes MLS data, active listings, November 18, 2026 |
| Metro Vancouver, condos | 7,699 | 27.4% | 4.6% | $30,000 | Strawhomes MLS data, active listings, November 18, 2026 |
| Metro Vancouver, all types | 18,748 | 26.0% | 4.8% | $50,000 | Strawhomes MLS data, active listings, November 18, 2026 |
| Fraser Valley, houses | 1,578 | 34.4% | 5.0% | $50,000 | Strawhomes MLS data, active listings, November 18, 2026 |
| Fraser Valley, townhouses | 493 | 36.1% | 3.7% | $25,000 | Strawhomes MLS data, active listings, November 18, 2026 |
| Fraser Valley, condos | 574 | 30.8% | 5.2% | $20,000 | Strawhomes MLS data, active listings, November 18, 2026 |
| Fraser Valley, all types | 2,709 | 33.8% | 4.8% | $35,000 | Strawhomes MLS data, active listings, November 18, 2026 |
| Both regions, houses | 8,771 | 26.5% | 5.5% | $100,000 | Strawhomes MLS data, active listings, November 18, 2026 |
| Both regions, townhouses | 3,455 | 28.6% | 3.9% | $30,500 | Strawhomes MLS data, active listings, November 18, 2026 |
| Both regions, condos | 8,273 | 27.6% | 4.7% | $29,000 | Strawhomes MLS data, active listings, November 18, 2026 |
| Both regions, all types | 21,457 | 26.9% | 4.8% | $49,000 | Strawhomes MLS data, active listings, November 18, 2026 |
- Houses, Metro Vancouver: 24.7%
- Houses, Fraser Valley: 34.4%
- Townhouses, Metro Vancouver: 27.3%
- Townhouses, Fraser Valley: 36.1%
- Condos, Metro Vancouver: 27.4%
- Condos, Fraser Valley: 30.8%
- All types, Metro Vancouver: 26.0%
- All types, Fraser Valley: 33.8%
34.4%: Fraser Valley houses with a price cut, against a lower share for Metro Vancouver houses. (Strawhomes MLS data, active listings, November 18, 2026, 2026)
The gap between the two regions is widest for detached houses. In the Fraser Valley 34.4% of detached listings have cut, in Metro Vancouver 24.7%. Metro Vancouver house sellers who do cut go deeper, though: a median 5.6%, or $100,000, against $50,000 in the Fraser Valley.
Townhouse cuts, or townhomes in board terms, are frequent but small, a median 3.9% of the original price. In the condo market cuts are the smallest in dollars, $29,000 at the median. Price cuts are not the only direction: 313 listings, or 1.5%, are now priced above where they started, usually after a first price set too low to draw offers.
How Long Before Sellers Cut? Days on the Market in the Metro Vancouver Housing Market
Few sellers cut in the first month: 5.2% of listings up to 30 days old are below their first price. The share climbs to 34.4% at 61 to 90 days and 44.8% after six months (Strawhomes MLS data, active listings, November 18, 2026, 2026). Listings with a cut have been for sale a median 100 days, against 50 days.
| Days listed | Active listings | Share cut, both regions | Metro Vancouver | Fraser Valley | Median net cut | Source |
|---|---|---|---|---|---|---|
| 0 to 30 days | 5,659 | 5.2% | 5.1% | 6.3% | 3.6% | Strawhomes MLS data, active listings, November 18, 2026 |
| 31 to 60 days | 4,577 | 22.3% | 21.5% | 27.9% | 3.8% | Strawhomes MLS data, active listings, November 18, 2026 |
| 61 to 90 days | 3,595 | 34.4% | 33.6% | 39.2% | 4.3% | Strawhomes MLS data, active listings, November 18, 2026 |
| 91 to 180 days | 4,953 | 41.0% | 39.7% | 48.9% | 5.2% | Strawhomes MLS data, active listings, November 18, 2026 |
| 181 days or more | 2,673 | 44.8% | 43.3% | 55.2% | 7.1% | Strawhomes MLS data, active listings, November 18, 2026 |
- 0 to 30 days: 5.2%
- 31 to 60 days: 22.3%
- 61 to 90 days: 34.4%
- 91 to 180 days: 41.0%
- 181 days or more: 44.8%
- Reference line, All listings, both regions: 26.9%
55.2%: Fraser Valley listings on the market for six months or more that have cut their price. (Strawhomes MLS data, active listings, November 18, 2026, 2026)
The second month is where most sellers blink. The share with a cut jumps from 5.2% to 22.3% between the first and second month, and the cuts get deeper with time: a median 3.6% in the first month, 7.1% after six months. In the Fraser Valley, more than half of the listings on the market for 181 days or more have cut (55.2%).
That is longer than a typical sale takes. The Fraser Valley board puts the average time to sell a detached home at 50 days and a condo at 44 days (Fraser Valley Real Estate Board, October 2026 statistics package, 2026), so a listing at day 60 without an offer is already slow. Our guide to how long it takes to sell a house explains what drives the clock, and the best time of year to sell covers the seasonal part of it.
Does a Higher Home Price Mean a Bigger Price Cut in the BC Housing Market?
Cheaper homes cut more often, expensive homes cut deeper. 30.8% of listings that started under $750,000 have cut, against 19.4% of listings that started at $3 million and up (Strawhomes MLS data, active listings, November 18, 2026, 2026). The median cut rises from 4.6% to 6.8%.
| Original list price | Active listings | Share with a price cut | Median net cut | Median net cut ($) | Source |
|---|---|---|---|---|---|
| Under $750,000 | 7,117 | 30.8% | 4.6% | $24,100 | Strawhomes MLS data, active listings, November 18, 2026 |
| $750,000 to $1.5 million | 7,724 | 26.8% | 4.4% | $50,000 | Strawhomes MLS data, active listings, November 18, 2026 |
| $1.5 million to $3 million | 4,909 | 24.2% | 5.6% | $100,000 | Strawhomes MLS data, active listings, November 18, 2026 |
| $3 million and up | 1,707 | 19.4% | 6.8% | $300,000 | Strawhomes MLS data, active listings, November 18, 2026 |
- Under $750,000: 30.8%
- $750,000 to $1.5 million: 26.8%
- $1.5 million to $3 million: 24.2%
- $3 million and up: 19.4%
- Reference line, All listings, both regions: 26.9%
$300,000: The median price cut on a listing that started at $3 million or more. (Strawhomes MLS data, active listings, November 18, 2026, 2026)
Below $750,000 buyers can compare many similar units, so a price that is a little high shows at once. At the top, fewer sellers move, but those who do give up a median $300,000. Our guide on selling luxury real estate in BC covers why that end of the market takes longer to find its price.
The middle bands track the region as a whole: 26.8% of listings between $750,000 and $1.5 million have cut, by a median $50,000. Pricing from comparable sales, not from a neighbour's list price, is the usual way to avoid the cut altogether; see how to do a comparative market analysis.
Do Price Cuts Work? What Homes Sold For After a Cut in Greater Vancouver and the Fraser Valley
They sell, but for less. Of 27,662 homes sold from November 2025 to October 2026, 26.6% had cut first (Strawhomes MLS sold data, November 2025 to October 2026, 2026). Those homes sold for a median 91.5% of their original asking price. Homes that never cut sold for 97.4%.
| Region and type | Sales | Share that cut first | Median cut | Sold for, after a cut | Sold for, no cut | Source |
|---|---|---|---|---|---|---|
| Metro Vancouver, houses | 7,862 | 27.5% | 5.2% | 90.0% | 96.5% | Strawhomes MLS sold data, November 2025 to October 2026 |
| Metro Vancouver, townhouses | 4,860 | 24.7% | 4.0% | 92.9% | 98.0% | Strawhomes MLS sold data, November 2025 to October 2026 |
| Metro Vancouver, condos | 10,449 | 25.6% | 4.9% | 91.5% | 97.5% | Strawhomes MLS sold data, November 2025 to October 2026 |
| Metro Vancouver, all types | 24,148 | 25.7% | 4.8% | 91.4% | 97.4% | Strawhomes MLS sold data, November 2025 to October 2026 |
| Fraser Valley, houses | 1,985 | 33.2% | 5.1% | 91.3% | 97.3% | Strawhomes MLS sold data, November 2025 to October 2026 |
| Fraser Valley, townhouses | 786 | 31.0% | 3.6% | 93.7% | 98.0% | Strawhomes MLS sold data, November 2025 to October 2026 |
| Fraser Valley, condos | 690 | 33.5% | 5.1% | 91.2% | 97.0% | Strawhomes MLS sold data, November 2025 to October 2026 |
| Fraser Valley, all types | 3,514 | 32.8% | 4.8% | 91.8% | 97.5% | Strawhomes MLS sold data, November 2025 to October 2026 |
| Both regions, houses | 9,847 | 28.6% | 5.2% | 90.3% | 96.7% | Strawhomes MLS sold data, November 2025 to October 2026 |
| Both regions, townhouses | 5,646 | 25.6% | 3.9% | 93.0% | 98.0% | Strawhomes MLS sold data, November 2025 to October 2026 |
| Both regions, condos | 11,139 | 26.1% | 4.9% | 91.5% | 97.5% | Strawhomes MLS sold data, November 2025 to October 2026 |
| Both regions, all types | 27,662 | 26.6% | 4.8% | 91.5% | 97.4% | Strawhomes MLS sold data, November 2025 to October 2026 |
- All homes, No price cut: 97.4%
- All homes, After a price cut: 91.5%
- Houses, No price cut: 96.7%
- Houses, After a price cut: 90.3%
- Townhouses, No price cut: 98.0%
- Townhouses, After a price cut: 93.0%
- Condos, No price cut: 97.5%
- Condos, After a price cut: 91.5%
91.5%: Median sale price as a share of the original asking price, for homes that cut before selling. (Strawhomes MLS sold data, November 2025 to October 2026, 2026)
The gap between the two groups is about six points of the original price, more than the median cut itself (4.8%). So the homes that cut did not only give up the cut: they also sold below the reduced price. A first price that misses the market tends to cost twice, once in the cut and again in the offer that finally comes. Our article on asking price versus selling price looks at the same gap from the buyer's side.
Houses show it most. Metro Vancouver houses that cut sold for a median 90.0% of their first price, against 96.5% for houses that held their price. The share of sold homes that had cut (26.6%) is close to the share of today's listings with a cut, so the cut is a normal part of selling Metro Vancouver real estate, not a last resort. Common reasons a listing stalls are covered in home seller mistakes to avoid.
Why Now? The October 2026 Market Report Numbers Show a Buyer's Market
Both boards report a slow market. The Metro Vancouver sales-to-active listings ratio was 13.4% in October 2026 (Greater Vancouver REALTORS, October 2026 market report, 2026), close to the 12% level below which prices tend to fall. The Fraser Valley ratio was 11%, which its board calls a buyer's market (Fraser Valley Real Estate Board, October 2026 statistics package, 2026).
The ratios point the same way as the cut shares, though the areas differ: the Fraser Valley board area, at 11%, includes Surrey and Langley, which we count in Metro Vancouver. Metro Vancouver detached homes, at 11.6%, sit below the 12% line, while attached homes are at 16.5% (Greater Vancouver REALTORS, October 2026 market report, 2026). Greater Vancouver REALTORS says prices tend to rise when the ratio stays above 20%; no home type is near that. The difference between the two kinds of market is explained in sellers market vs buyers market.
Interest rate changes are part of the reason. Andrew Lis, the GVR chief economist, pointed to a surprise Bank of Canada rate hike and uncertainty about where mortgage rates are headed (Greater Vancouver REALTORS, October 2026 market report, 2026). A ratio is a monthly average, and a cut share is what sellers have done about it. Metro Vancouver had 15,688 homes listed for sale, 24% above the 10-year seasonal average, against 2,024 sales in October (Greater Vancouver REALTORS, October 2026 market report, 2026). If your listing has gone stale, the reasons a house is not selling are worth a look before the price comes down.
Price Cut Checker: Where Is the Typical Cut Within Your Budget?
Price Cut Checker: Where Is the Typical Cut Within Your Budget?
Enter the most you would cut from your asking price to see the city and home type pairs where the median net cut is at or below it. Active listings on November 18, 2026; pairs with at least 30 listings that have cut.
| City | Median net cut | Home type | Median cut, % of first price | Listings with a cut |
|---|---|---|---|---|
| Hope (37 of 101 listings cut) | $30,900 | Houses | 4.7% | 36.6% |
| Chilliwack (194 of 520 listings cut) | $45,050 | Houses | 4.7% | 37.3% |
| Abbotsford (125 of 450 listings cut) | $50,000 | Houses | 4.5% | 27.8% |
| Mission (117 of 306 listings cut) | $50,000 | Houses | 5.9% | 38.2% |
| Maple Ridge (154 of 471 listings cut) | $53,500 | Houses | 4.8% | 32.7% |
| Port Coquitlam (36 of 139 listings cut) | $59,500 | Houses | 4.3% | 25.9% |
| Coquitlam (107 of 376 listings cut) | $90,000 | Houses | 5% | 28.5% |
| Delta (100 of 360 listings cut) | $91,550 | Houses | 5.1% | 27.8% |
| New Westminster (44 of 144 listings cut) | $92,500 | Houses | 6.3% | 30.6% |
| Langley (186 of 638 listings cut) | $96,050 | Houses | 5.6% | 29.2% |
| Surrey (428 of 1752 listings cut) | $99,000 | Houses | 5.4% | 24.4% |
| North Vancouver (71 of 328 listings cut) | $100,900 | Houses | 4.8% | 21.6% |
| Burnaby (102 of 428 listings cut) | $110,556 | Houses | 5.5% | 23.8% |
| Richmond (125 of 543 listings cut) | $120,000 | Houses | 5.8% | 23% |
| White Rock (31 of 129 listings cut) | $125,000 | Houses | 6.7% | 24% |
| Vancouver (266 of 1220 listings cut) | $198,500 | Houses | 6.5% | 21.8% |
| West Vancouver (58 of 391 listings cut) | $300,000 | Houses | 7.2% | 14.8% |
| Chilliwack (84 of 195 listings cut) | $21,000 | Townhouses | 3.6% | 43.1% |
| Langley (76 of 270 listings cut) | $25,500 | Townhouses | 3.3% | 28.1% |
| Abbotsford (71 of 219 listings cut) | $26,500 | Townhouses | 3.8% | 32.4% |
| Maple Ridge (45 of 132 listings cut) | $29,100 | Townhouses | 3.8% | 34.1% |
| Burnaby (66 of 215 listings cut) | $29,600 | Townhouses | 3.4% | 30.7% |
| Coquitlam (45 of 196 listings cut) | $30,000 | Townhouses | 3.3% | 23% |
| Surrey (294 of 893 listings cut) | $30,000 | Townhouses | 3.8% | 32.9% |
| Richmond (65 of 313 listings cut) | $40,000 | Townhouses | 4.3% | 20.8% |
| Vancouver (102 of 483 listings cut) | $67,500 | Townhouses | 4.7% | 21.1% |
| Chilliwack (60 of 168 listings cut) | $18,050 | Condos | 4.9% | 35.7% |
| Langley (111 of 377 listings cut) | $20,000 | Condos | 3.6% | 29.4% |
| Port Coquitlam (52 of 156 listings cut) | $20,000 | Condos | 3.7% | 33.3% |
| Maple Ridge (58 of 127 listings cut) | $20,450 | Condos | 4.8% | 45.7% |
| Port Moody (32 of 129 listings cut) | $22,900 | Condos | 3.4% | 24.8% |
| Abbotsford (97 of 317 listings cut) | $24,001 | Condos | 5.7% | 30.6% |
| New Westminster (103 of 326 listings cut) | $24,100 | Condos | 3.9% | 31.6% |
| Surrey (285 of 1043 listings cut) | $24,100 | Condos | 4.9% | 27.3% |
| Coquitlam (149 of 550 listings cut) | $25,000 | Condos | 4.3% | 27.1% |
| Delta (37 of 103 listings cut) | $28,900 | Condos | 5.4% | 35.9% |
| Burnaby (329 of 1073 listings cut) | $30,000 | Condos | 4.8% | 30.7% |
| North Vancouver (105 of 422 listings cut) | $30,000 | Condos | 4.1% | 24.9% |
| Richmond (223 of 862 listings cut) | $31,000 | Condos | 5.2% | 25.9% |
| White Rock (58 of 160 listings cut) | $32,944 | Condos | 5.3% | 36.2% |
| Vancouver (518 of 2188 listings cut) | $38,000 | Condos | 4.8% | 23.7% |
How We Counted Price Cuts in the Vancouver Real Estate Market
A listing has a net price cut when its list price today is lower than the original list price on the same MLS listing. This is the same test as the Price Reduced filter on our search, applied to active residential listings for sale on the day of the count: houses, townhouses, condos (condominium apartments) and half duplexes, without land, rentals or income properties. We report medians, not the average home price, so a few large cuts on luxury homes do not drive the result. A cut is about the asking price, not home values: a home is the largest asset most sellers own, so the money at stake is large, and the list price is only the seller's first guess at its worth.
Net means the change from the first price to today's price. A listing that was cut twice counts once, a listing that was cut and then raised back counts as no cut, and a home taken off the market and relisted starts again with a new original price. That last case is common in a slow market, so the real share of homes that have cut at some point is higher than these numbers. A rising share of cuts is the opposite of price growth, and it usually shows up in listings before it shows up in the benchmark price. In a market with this much inventory, cuts reflect buyer confidence and the market dynamics between buyers and sellers as much as any one seller's pricing. New housing sold by developers outside the MLS is not counted, and list prices do not include GST or property transfer tax.
Frequently Asked Questions
How many homes for sale in Metro Vancouver and the Fraser Valley have had a price cut?
On November 18, 2026, 5,781 of 21,457 active residential listings, or 26.9%, were priced below their original list price. The share was 33.8% in the Fraser Valley and 26.0% in Metro Vancouver. This counts the net change since the listing started, from Strawhomes MLS data. (Strawhomes MLS data, active listings, November 18, 2026, 2026)
How much do sellers typically reduce their asking prices?
The median net cut is 4.8% of the original list price, about $49,000. Houses cut more in dollars ($100,000 median) than condos ($29,000). Listings priced at $3 million and up cut a median 6.8%. (Strawhomes MLS data, active listings, November 18, 2026, 2026)
How long before sellers lower the price?
Few cut in the first month: 5.2% of listings up to 30 days old have a cut. The share rises to 34.4% at 61 to 90 days and 44.8% after 181 days. Listings with a cut have been on the market a median 100 days, twice the 50 days of listings without one. (Strawhomes MLS data, active listings, November 18, 2026, 2026)
Do homes that cut their price still sell for less?
Yes. Across 27,662 sales from November 2025 to October 2026, homes that had cut sold for a median 91.5% of their original asking price. Homes that never cut sold for 97.4%. 26.6% of sold homes had cut first. (Strawhomes MLS sold data, November 2025 to October 2026, 2026)
How do price cuts vary by city across the Metro Vancouver and Fraser Valley housing market?
Among cities with at least 30 listings, Cultus Lake (40.0%, 30 listings) and Chilliwack (38.2%) lead. Maple Ridge (35.7%) tops Metro Vancouver. West Vancouver (15.7%) and Bowen Island have the fewest cuts. (Strawhomes MLS data, active listings, November 18, 2026, 2026)
Is the Metro Vancouver housing market a buyer's market right now?
In October 2026 the Metro Vancouver sales-to-active listings ratio was 13.4%, just above the 12% level below which Greater Vancouver REALTORS says prices tend to fall. The Fraser Valley board reported 11% and called it a buyer's market. Detached homes in Metro Vancouver were at 11.6%. (Greater Vancouver REALTORS and Fraser Valley Real Estate Board, October 2026, 2026)
Are Vancouver home prices dropping in 2026?
Yes, slowly, which helps affordability. The Metro Vancouver composite benchmark price was $1,068,600 in October 2026, a 5.2% year-over-year decrease and 0.7% below September 2026. The Fraser Valley composite benchmark price was $860,000, down 6.4% year-over-year. Price cuts on listings point the same way: 26.9% of homes for sale are below their first asking price. (Greater Vancouver REALTORS and Fraser Valley Real Estate Board, October 2026, 2026)
How can buyers assess a price-reduced listing?
Look at how long it has been for sale and how far it has already come down. Listings with a cut have been on the market a median 100 days, and homes that cut before selling went for a median 91.5% of their original asking price. Ask your real estate agent for recent sales of similar homes before you make an offer, whether you are buying a home to live in or as a real estate investment; in real estate investing, the cut is only a starting point. (Strawhomes MLS sold data, November 2025 to October 2026, 2026)
Methodology
Active listings: every residential listing for sale (status Active) in Metro Vancouver and Fraser Valley cities on November 18, 2026, from the MLS data feed behind strawhomes.com, with list price and original list price both above zero. Regions follow the regional districts (the Metro Vancouver Regional District and the Fraser Valley Regional District), so Surrey, Langley and White Rock are in Metro Vancouver even though they belong to the Fraser Valley Real Estate Board (FVREB) area. City is the MLS city field, which lists Tsawwassen and Ladner apart from Delta and keeps Vancouver whole, so the Vancouver Westside and East Vancouver are not split. This is a local count and says nothing about the wider Canada housing market. Days listed count from the listing date shown on each listing. Cities and cells with fewer than 30 listings are not shown, and a median cut is shown only where at least 30 listings have cut. Sold homes: residential sales that completed from November 2025 to October 2026, comparing the final list price with the original list price and the sale price with the original list price; 1,664 sales without a stored original price are left out. Board ratios and days to sell are copied from the Greater Vancouver REALTORS and Fraser Valley Real Estate Board releases for October 2026. Limits: the feed keeps no price history, so we cannot count cuts per listing or date them, and expired, cancelled and terminated listings cannot be separated, so they are not measured. Individual listings and sellers are never shown, only totals. Recency check: social and web search for the last 30 days, no newer public count found.
Sources consulted: 103
Sources cited: 4
Data freshness: current year: 4, last year: 0, older: 0
Data range: Active listings on November 18, 2026; sales closed November 2025 to October 2026; board releases for October 2026
Research date: 2026-11-18
Update schedule: Quarterly
Limitations: Net cut compares today's list price with the original list price of the same MLS listing. A home cancelled and relisted gets a new listing and a new original price, so its earlier cut is not seen: the shares are a floor. Price history is not stored, so the number and timing of cuts per listing are not known. Expired and terminated listings cannot be told apart and are not measured.
Sources & References
- Strawhomes MLS data, active listings, November 18, 2026. "Strawhomes MLS listings with a price reduction (live search)." strawhomes.com/search/?priceReduced=true. Accessed 2026-11-18.
- Strawhomes MLS sold data, November 2025 to October 2026. "Real Estate Market Stats (MLS sold data by city and type)." strawhomes.com/mls/trends/. Accessed 2026-11-18.
- Greater Vancouver REALTORS. "Monthly Market Report, October 2026." members.gvrealtors.ca/news/GVR-Stats-Package-October-2026.pdf. Accessed 2026-11-18.
- Fraser Valley Real Estate Board. "Monthly Statistics Package, October 2026." fvreb.bc.ca/statistics/Package202610.pdf. Accessed 2026-11-18.

Let's Chat! Looking for a REALTOR® who can exceed your expectations? Look no further than Richard Morrison! His mission is to serve without limit & provide solutions that cater to your core needs.
• 20+ Years of Experience
• Medallion Member
• RE/MAX Hall of Fame

Latest Properties Added
| Property | Size | Price | Date Listed |
|---|---|---|---|
| 142 - 1833 165a Street, Surrey | 1,500 sqft | $1,199,900 | Nov 18, 2026 |
| 1105 - 9595 Erickson Drive, Burnaby | 748 sqft | $388,000 | Nov 18, 2026 |
| 7772 196 Street, Langley | 2,449 sqft | $1,200,000 | Nov 18, 2026 |
| PH10 - 1082 Seymour Street, Vancouver | 547 sqft | $597,800 | Nov 17, 2026 |
| 40 - 1268 Riverside Drive, Port Coquitlam | 1,648 sqft | $799,000 | Nov 18, 2026 |
| 12411 57b Avenue, Surrey | 3,749 sqft | $2,249,879 | Nov 18, 2026 |
| 208 - 128 8th, North Vancouver | 972 sqft | $820,000 | Nov 17, 2026 |
| 215 - 5650 201a Street, Langley | 725 sqft | $399,000 | Nov 17, 2026 |
| 18 - 3009 156 Street, Surrey | 2,042 sqft | $869,988 | Nov 18, 2026 |
| 504 - 10778 138 Street, Surrey | 651 sqft | $449,000 | Nov 18, 2026 |
| 3303 - 6538 Nelson Avenue, Burnaby | 998 sqft | $970,000 | Nov 17, 2026 |
| 103 - 651 Rochester Avenue, Coquitlam | 1,549 sqft | $1,529,900 | Nov 16, 2026 |
Start your search with Richard Morrison, Top Award Winning Vancouver Realtor
Contact Richard Morrison Top Vancouver Realtor today to find a Vancouver houses for sale and Vancouver condos for sale. Also check out Burnaby houses for sale or maybe Burnaby condos for sale. If you prefer North Shore, take a look at our listings in North Vancouver houses for sale and North Vancouver condos for sale.