Average Utility Bill in Canada: Monthly Utility Costs by City and Home Type (2026)
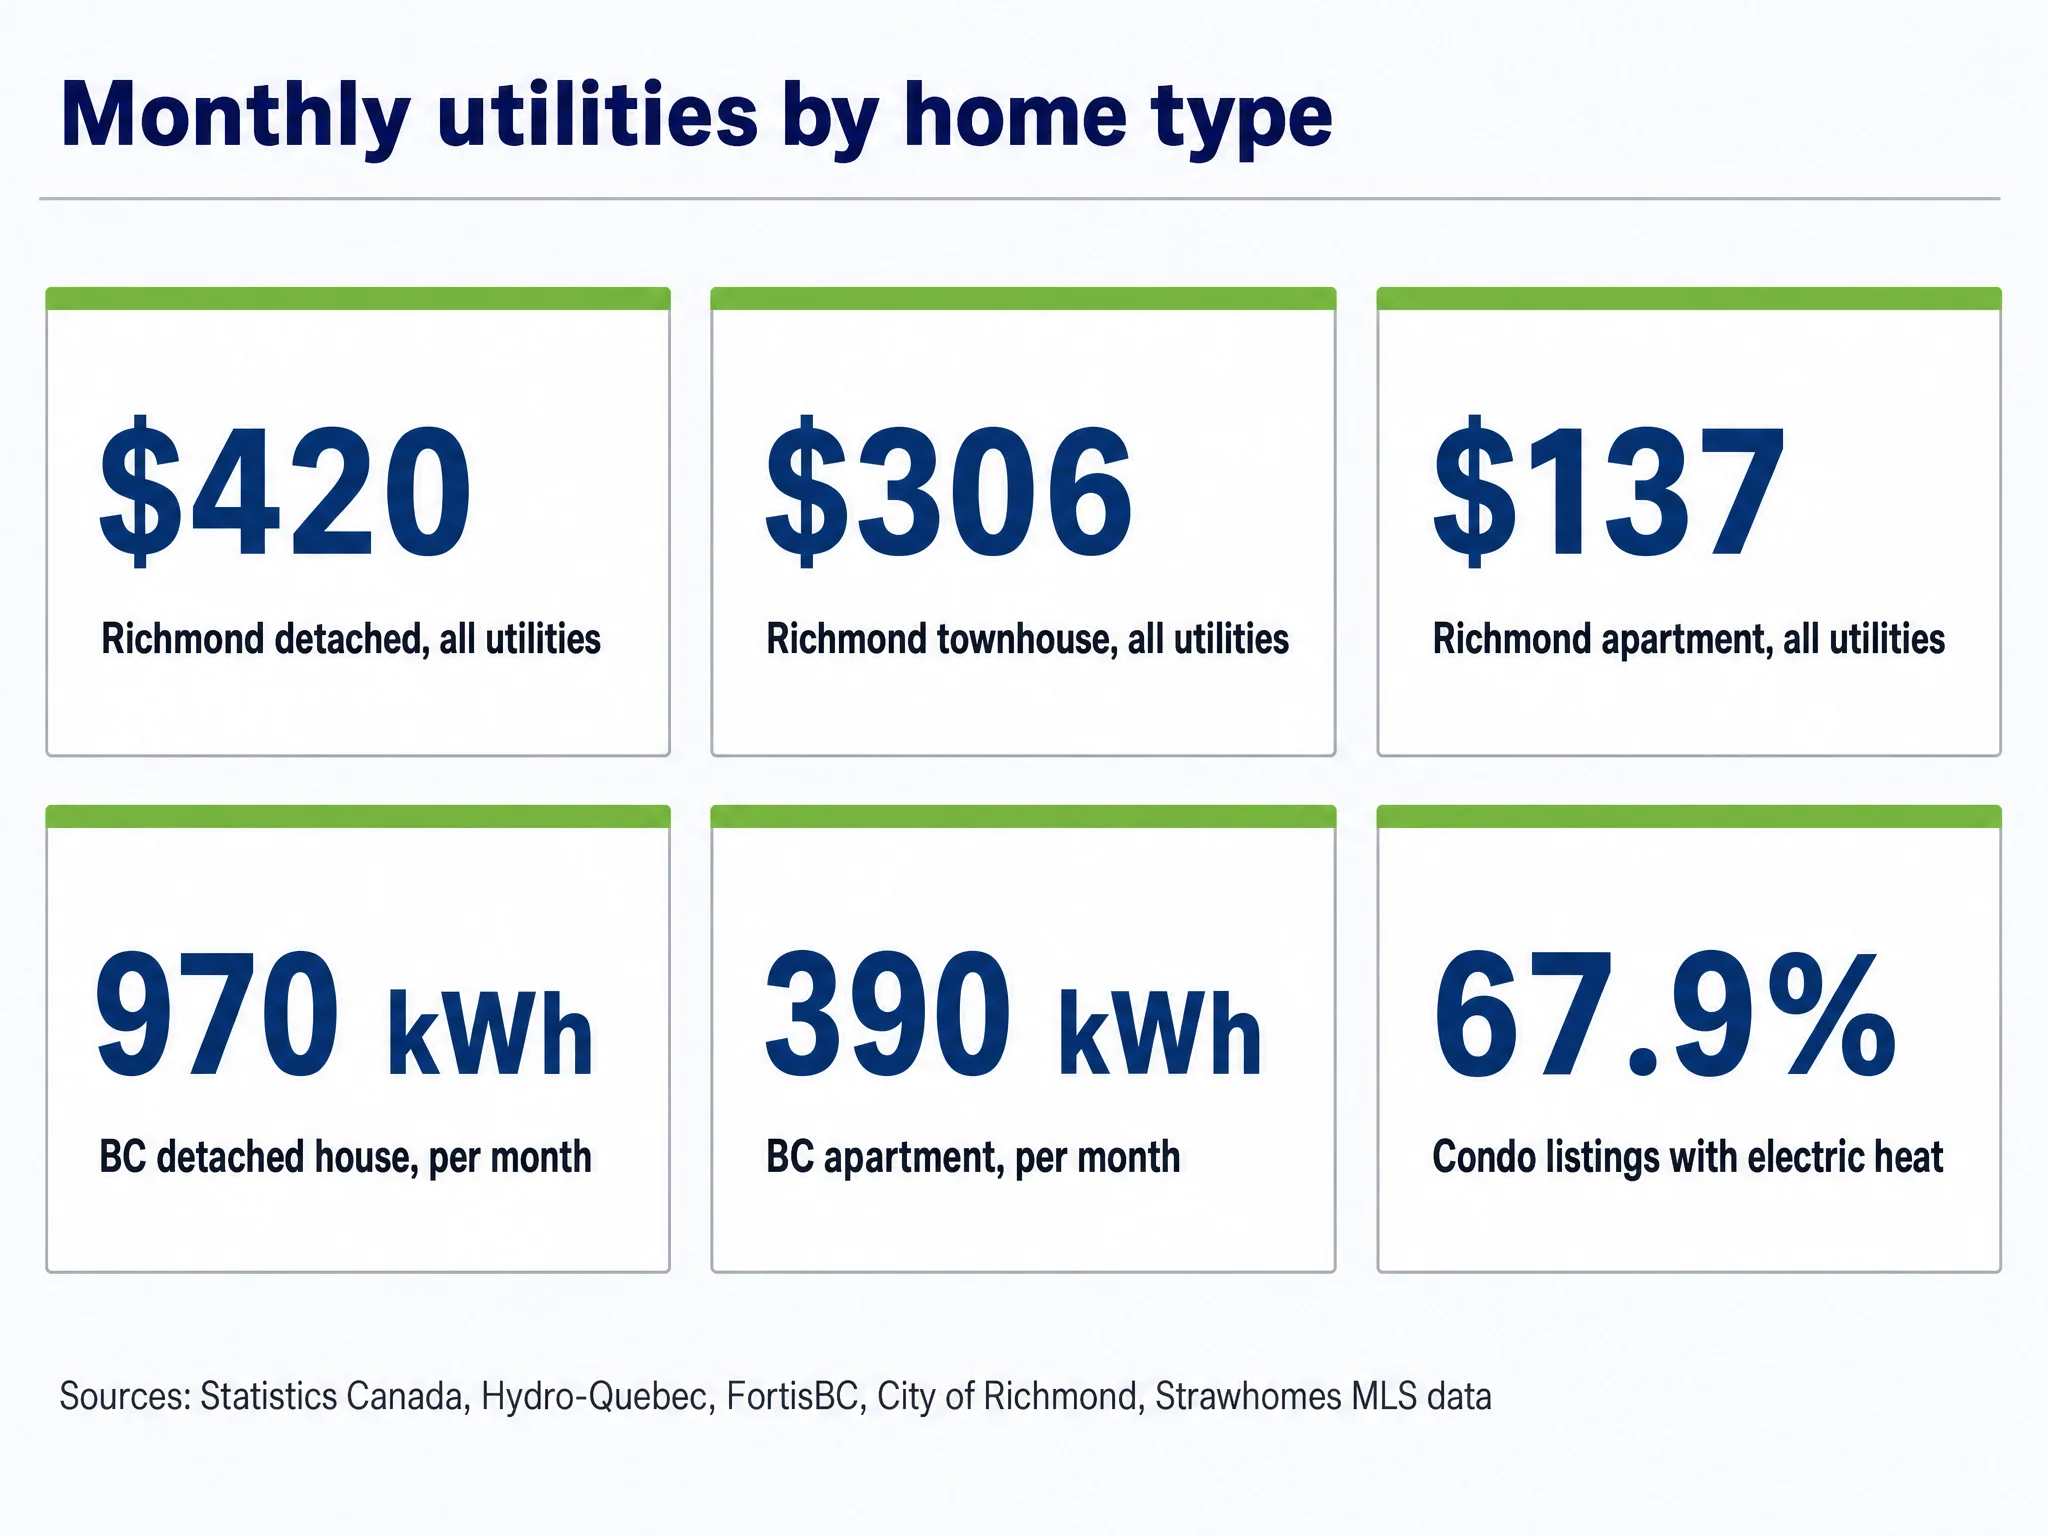
$420: A detached house in Richmond, BC costs an estimated $420 a month for electricity, natural gas, water, sewer and garbage, an upper-end estimate roughly three times the $137 for an apartment in the same city. Source: City of Richmond (2026)
Key Takeaways
- 970 kWh Average monthly electricity use of a BC detached house, against 390 kWh for a BC apartment, 2021 survey. (Statistics Canada, 2021)
- $165 Estimated monthly electricity bill for a Calgary detached house at Alberta's average use, well under the $229.04 bill at the 1,000 kWh level most comparisons quote. (Hydro-Québec, 2025)
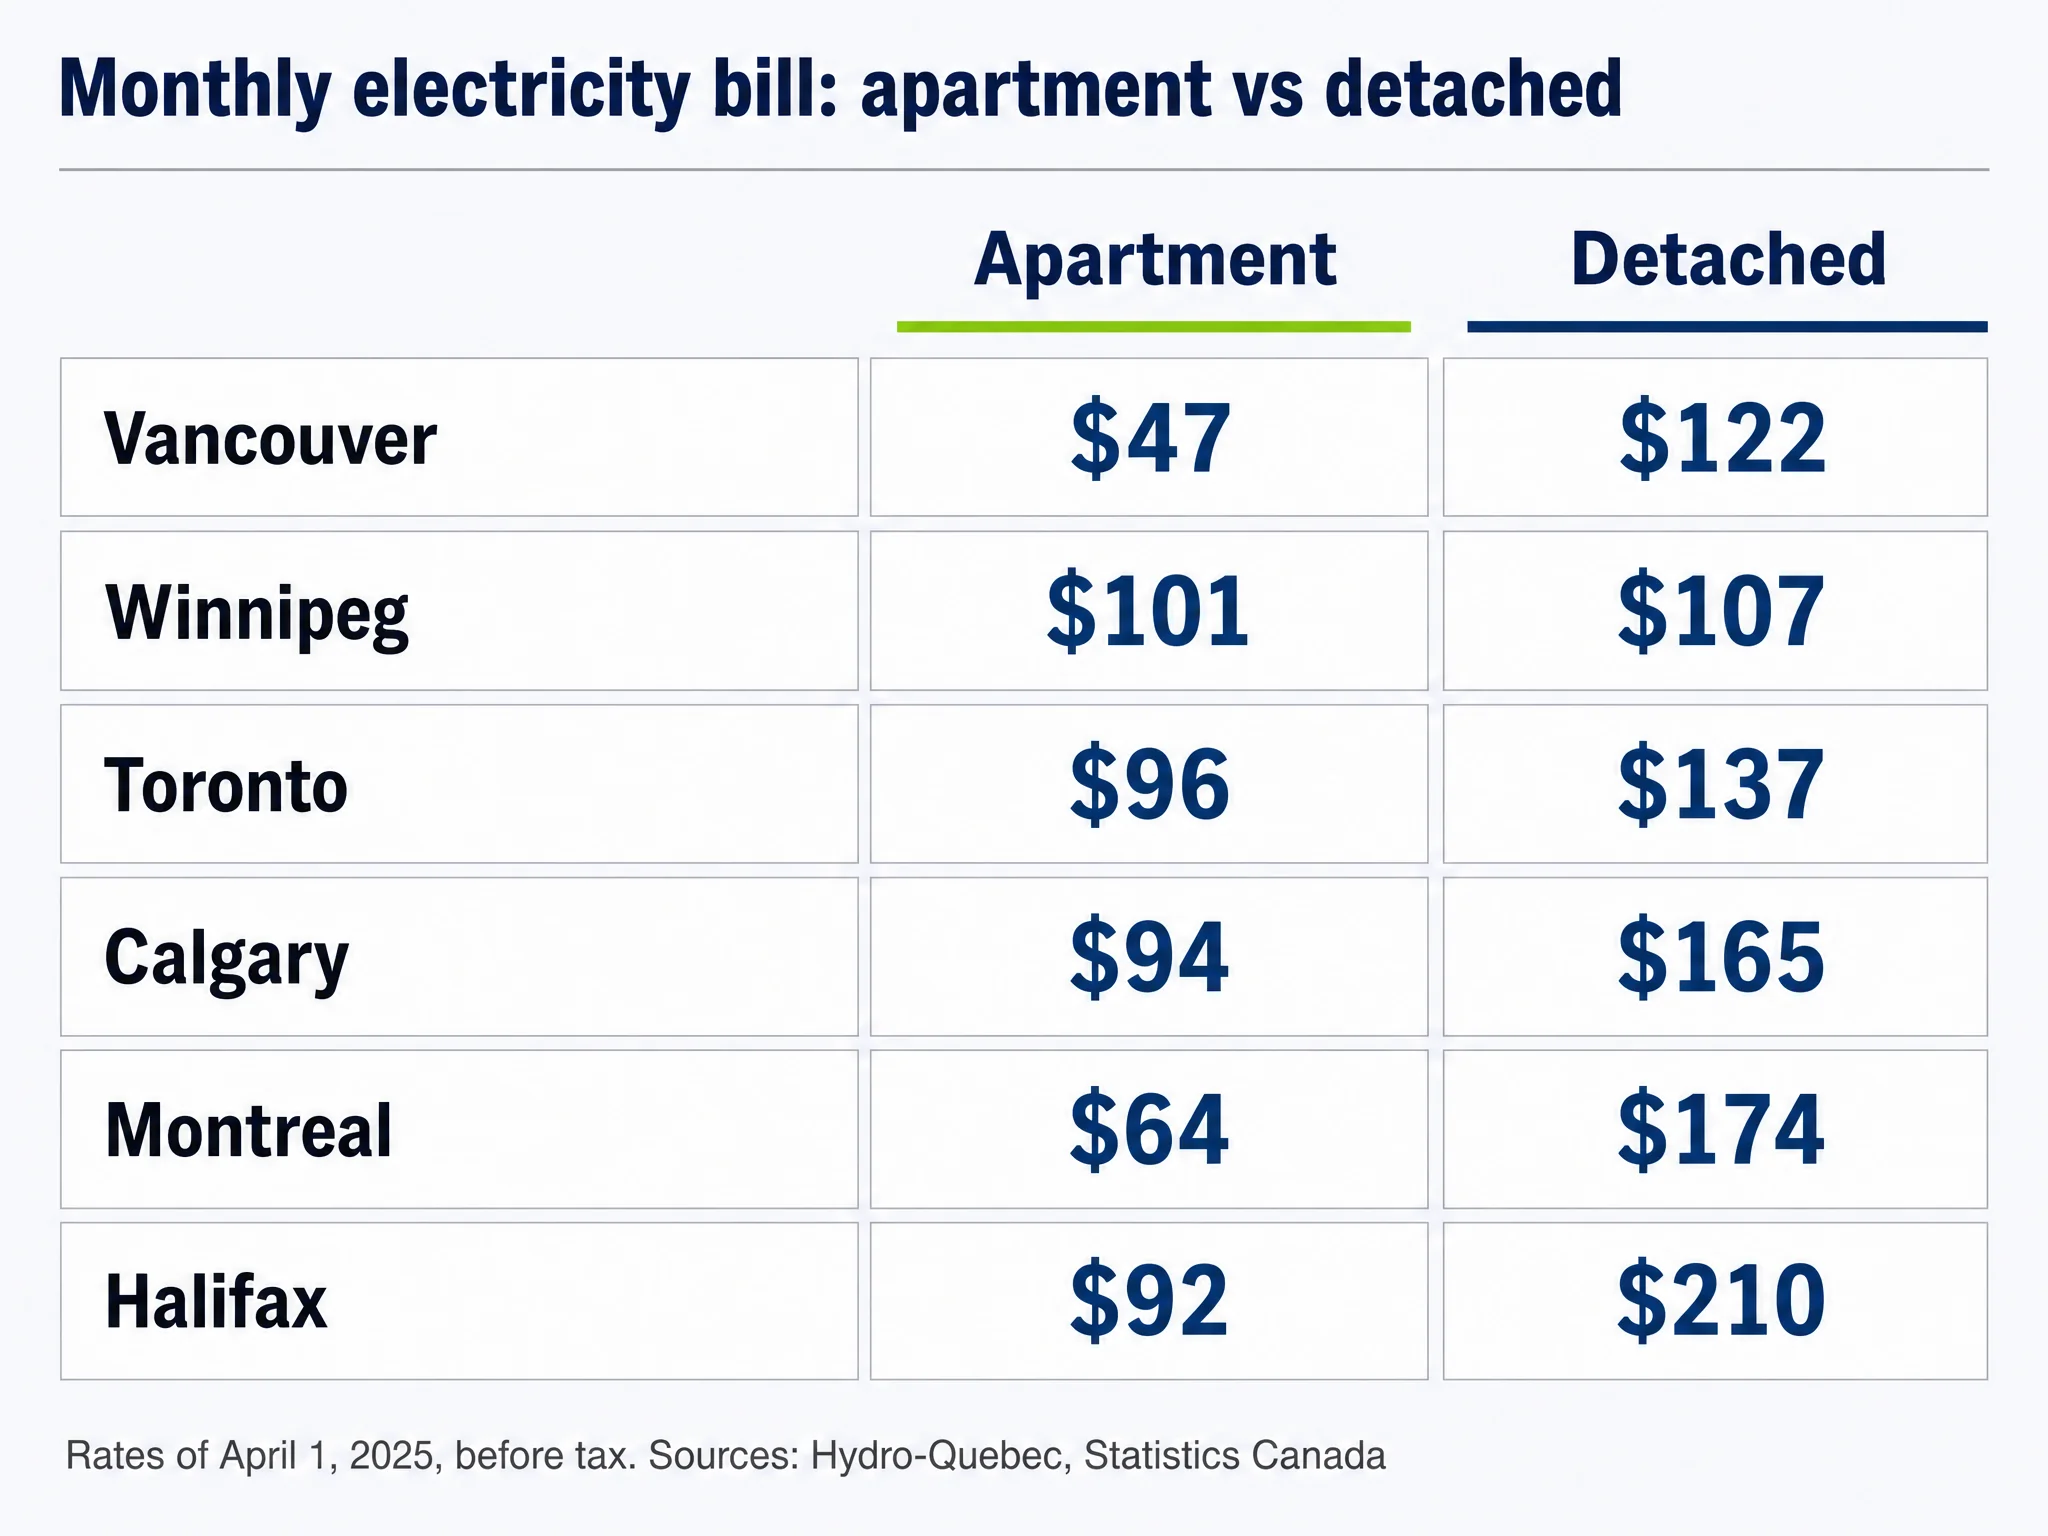
- $47 Estimated monthly BC Hydro bill for a Vancouver apartment at April 2025 rates, before tax; a detached house runs $122. (Hydro-Québec, 2025)
- 67.9% Share of condo listings in the Greater Vancouver and Fraser Valley board areas that name electric or baseboard heat; only 10.5% name natural gas. (Strawhomes MLS data, 2026)
- $110 Estimated monthly FortisBC gas bill for a gas-heated BC detached house at July 2026 rates, before tax. (FortisBC, 2026)
- $1,088 Coquitlam's 2026 water and sewer charge per apartment or townhouse unit, against $1,661 for a house with a small garbage cart. (City of Coquitlam, 2026)
- $4,459 What Alberta households spent on water, fuel and electricity in 2023, the most of any province; Quebec households spent $1,851. (Statistics Canada, 2023)
A detached house in Richmond, BC costs an estimated $420 a month for electricity, natural gas, water, sewer and garbage, an upper-end figure roughly three times the $137 an apartment in the same city pays (City of Richmond, 2026). That gap is bigger than the gap between most cities, yet comparisons of the average utility bill in Canada set utility costs across cities at one number each.
The usual number is the electricity bill at 1,000 kWh a month, the level Hydro-Québec uses to rank cities each year (Hydro-Québec, 2025). Few homes use exactly that. Statistics Canada's energy survey puts a BC apartment at about 390 kWh a month and a Quebec detached house at 1,920 kWh (Statistics Canada, 2021), so the 1,000 kWh bill overstates what a condo owner pays and understates what many house owners pay. Home energy use, not the city, sets most of the average monthly cost.
This page reads each city's published electricity bills at the average use of an apartment, a townhouse and a detached house in that province, adds natural gas and city water charges for Metro Vancouver, and checks the result against what households actually spend. If you are buying a home, the cost of utilities belongs in your monthly housing costs next to the mortgage, property tax, home insurance and strata fee in any home affordability check.
How Much Is the Electricity Bill per Month in 12 Canadian Cities, From Toronto to Vancouver, by Home Type?
At rates in effect April 1, 2025, before tax, a detached house pays an estimated $122 a month for electricity in Vancouver, $165 in Calgary, $137 in Toronto and $210 in Halifax (Hydro-Québec, 2025). Apartments pay from $47 in Vancouver to $122 in Moncton.
| City | Apartment | Townhouse | Detached house | Published bill at 1,000 kWh | Source |
|---|---|---|---|---|---|
| Vancouver | $47 | $105 | $122 | $126.02 | Hydro-Québec |
| Calgary | $94 | $115 | $165 | $229.04 | Hydro-Québec |
| Edmonton | $85 | $107 | $157 | $220.02 | Hydro-Québec |
| Regina | $82 | $113 | $137 | $178.94 | Hydro-Québec |
| Winnipeg | $101 | n/a | $107 | $105.33 | Hydro-Québec |
| Toronto | $96 | $109 | $137 | $155.69 | Hydro-Québec |
| Ottawa | $85 | $98 | $125 | $143.51 | Hydro-Québec |
| Montréal | $64 | $121 | $174 | $82.90 | Hydro-Québec |
| Moncton | $122 | n/a | $237 | $166.08 | Hydro-Québec |
| Halifax | $92 | n/a | $210 | $204.78 | Hydro-Québec |
| Charlottetown | $118 | n/a | $183 | $196.87 | Hydro-Québec |
| St. John’s | $115 | n/a | $211 | $155.86 | Hydro-Québec |
- Montréal, Apartment: $64
- Montréal, Detached house: $174
- Vancouver, Apartment: $47
- Vancouver, Detached house: $122
- Halifax, Apartment: $92
- Halifax, Detached house: $210
- Moncton, Apartment: $122
- Moncton, Detached house: $237
- Edmonton, Apartment: $85
- Edmonton, Detached house: $157
- St. John’s, Apartment: $115
- St. John’s, Detached house: $211
- Calgary, Apartment: $94
- Calgary, Detached house: $165
- Regina, Apartment: $82
- Regina, Detached house: $137
- Charlottetown, Apartment: $118
- Charlottetown, Detached house: $183
- Ottawa, Apartment: $85
- Ottawa, Detached house: $125
- Toronto, Apartment: $96
- Toronto, Detached house: $137
- Winnipeg, Apartment: $101
- Winnipeg, Detached house: $107
2.7x: In Montréal a detached house pays this multiple of an apartment's electricity bill, the widest gap of the 12 cities, because most Quebec houses heat with electricity. (Hydro-Québec, 2025)
Electricity costs rank differently by home type, because how much you pay depends on kWh used as well as price. Montréal has one of the cheapest bills at 1,000 kWh, $82.90, but a typical Quebec house uses far more than that, so its detached estimate lands at $174, above Vancouver and Toronto. Calgary works the other way: its 1,000 kWh bill is $229.04, but an Alberta house heats with gas and uses much less electricity, so lower electricity use brings the estimate to $165, even in a deregulated electricity market with high fixed service costs. Halifax, at $210 for a house, is one of the most expensive of the 12. The same logic explains the gap between the cost of living in Montreal and Vancouver once heating is counted.
Vancouver apartments pay the least of any city and home type, about $47 a month. BC Hydro has a low fixed charge and BC apartments use little power, and a detached house still pays 2.6x as much. BC rates rose another 3.75% on April 1, 2026 (Government of British Columbia, 2025), so your actual bill in 2026 sits a little above these figures. BC Hydro is a public utility built on hydroelectricity, and its electricity pricing ranks third lowest of the 22 cities in Hydro-Québec's study. Winnipeg is the flattest, because many Manitoba apartments heat with electricity.
Ontario electricity bills also vary across Ontario, because each local utility such as Toronto Hydro or Hydro Ottawa sets its own delivery charges, and the Ontario Energy Board resets regulated prices each November; Greater Toronto Area suburbs and rural areas can pay a different cost of power. Townhouse cells are blank for Atlantic Canada and Winnipeg because Statistics Canada suppressed those estimates for sample size; we did not fill them in.
How Many kWh Does a Condo, Townhouse or House Use per Month Across Canada?
The average Canadian apartment uses about 530 kWh of electricity a month, a row townhouse 740 kWh and a detached house 1,120 kWh (Statistics Canada, 2021). The spread by province is wide: a detached house uses 670 kWh in Alberta and 1,920 kWh in Quebec, where electric heat is the norm.
| Province | Apartment | Townhouse | Detached house | Source |
|---|---|---|---|---|
| British Columbia | 390 kWh | 840 kWh | 970 kWh | Statistics Canada |
| Alberta | 300 kWh | 410 kWh | 670 kWh | Statistics Canada |
| Saskatchewan | 350 kWh | 560 kWh | 720 kWh | Statistics Canada |
| Manitoba | 950 kWh | n/a | 1,020 kWh | Statistics Canada |
| Ontario | 480 kWh | 600 kWh | 840 kWh | Statistics Canada |
| Quebec | 730 kWh | 1,380 kWh | 1,920 kWh | Statistics Canada |
| New Brunswick | 680 kWh | n/a | 1,520 kWh | Statistics Canada |
| Nova Scotia | 390 kWh | n/a | 1,030 kWh | Statistics Canada |
| Prince Edward Island | 540 kWh | n/a | 920 kWh | Statistics Canada |
| Newfoundland and Labrador | 710 kWh | n/a | 1,390 kWh | Statistics Canada |
| Canada | 530 kWh | 740 kWh | 1,120 kWh | Statistics Canada |
- Calgary, Apartment: $94
- Calgary, Detached house: $165
- Calgary, Quoted 1,000 kWh bill: $229
- Edmonton, Apartment: $85
- Edmonton, Detached house: $157
- Edmonton, Quoted 1,000 kWh bill: $220
- Toronto, Apartment: $96
- Toronto, Detached house: $137
- Toronto, Quoted 1,000 kWh bill: $156
- Montréal, Apartment: $64
- Montréal, Detached house: $174
- Montréal, Quoted 1,000 kWh bill: $83
970 kWh: Average monthly electricity use of a BC detached house, about two and a half times a BC apartment. (Statistics Canada, 2021)
These are 2021 Statistics Canada averages, converted from gigajoules a year to kWh a month. They mix electrically heated and gas-heated homes, so an all-electric BC house with baseboard heat will use more than 970 kWh, and a gas-heated Ontario townhouse less than 600 kWh. Home size matters too: a larger home with a basement suite, more heating and cooling and older building insulation is not the average house, which is one of the trade-offs of a detached house buyers tend to underestimate.
The household figures also explain why the 1,000 kWh benchmark misleads. Only detached homes in Quebec, Manitoba and parts of Atlantic Canada (New Brunswick, Nova Scotia and Newfoundland and Labrador) average more than that, and only Manitoba apartments come close to it. In BC, Alberta, Saskatchewan and Ontario, every home type averages under it, which is why the Calgary and Vancouver estimates in the first table sit below the published 1,000 kWh bills.
Do Metro Vancouver Condos Heat With Electricity or Gas? What Our Listing Data Shows
Mostly electricity. Of 10,174 condo listings in the Greater Vancouver and Fraser Valley board areas that name a heating system, 67.9% name electric or baseboard heat and only 10.5% name natural gas (Strawhomes MLS data, 2026). For houses, 50.2% name natural gas.
| Area | Condos: electric or baseboard | Condos: natural gas | Townhouses: natural gas | Houses: natural gas | Source |
|---|---|---|---|---|---|
| All areas | 67.9% | 10.5% | 27.8% | 50.2% | Strawhomes MLS data |
| Vancouver | 58.7% | 9.4% | 16.8% | 46.9% | Strawhomes MLS data |
| Surrey | 79.2% | 10.8% | 29.0% | 51.3% | Strawhomes MLS data |
| Burnaby | 55.7% | 6.3% | 17.6% | 48.2% | Strawhomes MLS data |
| Richmond | 48.2% | 5.1% | 17.5% | 38.1% | Strawhomes MLS data |
| Coquitlam | 69.7% | 9.9% | 14.4% | 49.9% | Strawhomes MLS data |
| Langley | 90.6% | 11.6% | 37.5% | 60.7% | Strawhomes MLS data |
| Abbotsford | 92.9% | 13.6% | 35.0% | 61.5% | Strawhomes MLS data |
| North Vancouver | 57.7% | 16.3% | 28.1% | 45.9% | Strawhomes MLS data |
- Condos, Electric or baseboard: 67.9%
- Condos, Natural gas: 10.5%
- Condos, Heat pump: 21.3%
- Townhouses, Electric or baseboard: 56.1%
- Townhouses, Natural gas: 27.8%
- Townhouses, Heat pump: 16.7%
- Houses, Electric or baseboard: 23.7%
- Houses, Natural gas: 50.2%
- Houses, Heat pump: 8.9%
21.3%: Share of condo listings that name a heat pump, against fewer than one in ten house listings. (Strawhomes MLS data, 2026)
For a condo owner this means the hydro bill is the heating bill. Baseboard heaters run on the suite's own meter, which is why a top-floor corner unit can see winter bills well above the $47 average. Where a condominium building heats with a gas boiler or supplies hot water centrally, that gas is billed to the strata corporation and shows up in the monthly fee instead; check what the condo maintenance fee includes before comparing two suites.
Heat pumps are more common in condos and townhouses than in houses: 38.3% of Vancouver townhouse listings and 35.2% of Richmond condo listings name one. Houses lag, with 8.9% region-wide, while 38.1% of Richmond house listings name natural gas. A listing can name more than one system, so the shares do not add up to 100%. Ask about heating directly when you use our list of questions to ask when buying a condo.
How Much Does Natural Gas Heating Add to the Budget per Month for Each Home Type?
A gas-heated BC detached house uses about 92.8 GJ of natural gas a year (Statistics Canada, 2021). At FortisBC's Mainland rates effective July 1, 2026, that is about $110 a month before tax, and about $73 for a gas-heated townhouse (FortisBC, 2026). Alberta houses use the most gas in Canada, 123.5 GJ a year.
| Province | Apartment (gas users) | Townhouse (gas users) | Detached house (gas users) | Source |
|---|---|---|---|---|
| British Columbia | 58.5 GJ | 57.4 GJ | 92.8 GJ | Statistics Canada |
| Alberta | 76.0 GJ | 89.5 GJ | 123.5 GJ | Statistics Canada |
| Saskatchewan | 76.6 GJ | 65.6 GJ | 90.2 GJ | Statistics Canada |
| Manitoba | n/a | n/a | 75.7 GJ | Statistics Canada |
| Ontario | 69.2 GJ | 66.9 GJ | 86.5 GJ | Statistics Canada |
| Quebec | 34.3 GJ | n/a | 68.5 GJ | Statistics Canada |
| Canada | 67.2 GJ | 68.1 GJ | 93.8 GJ | Statistics Canada |
$12.601: What FortisBC charges for each gigajoule a Lower Mainland home burns, before the daily basic charge and tax. (FortisBC, 2026)
FortisBC's bill has two parts: a basic charge of $0.4216 a day, and three charges on every gigajoule used, delivery at $8.469, storage and transport at $2.472 and the cost of gas itself at $1.660 (FortisBC, 2026). Spread over a year, a gas-heated detached house burns about 7.7 GJ a month and a townhouse 4.8 GJ, but heating costs run higher in winter, and the winter cost is several times the summer one.
Gas furnaces are common in Ontario and the Prairies, and Alberta houses burn the most gas. Outside BC we show gas use, not dollars. Enbridge, ATCO with Alberta's default supply, SaskEnergy and Manitoba Hydro price gas by cubic metre with riders and monthly commodity changes, so a single monthly figure would hide more than it shows. The apartment column covers only households that buy gas; in many buildings a central boiler is paid through strata fees. That is one reason a townhouse versus detached home comparison should count heating separately.
What Are Full Utility Costs in 2026 for a House, Townhouse or Condo in Metro Vancouver?
Adding electricity, gas where it is used and 2026 city charges, our upper-end estimate is $420 a month for a Richmond detached house, $306 for a townhouse and $137 for an apartment (City of Richmond, 2026). In Coquitlam the figures are $370 and $138.
| City and home type | What the city charge covers | 2026 city utilities per year | City utilities per month | Estimated total per month | Source |
|---|---|---|---|---|---|
| Richmond, Detached house | Water, sewer, flood protection, garbage (metered, average use) | $2,250.57 | $188 | $420 | City of Richmond |
| Richmond, Townhouse | Water, sewer, flood protection, garbage (metered, average use) | $1,535.61 | $128 | $306 | City of Richmond |
| Richmond, Apartment | Water, sewer, flood protection, garbage (metered, average use) | $1,083.11 | $90 | $137 | City of Richmond |
| Coquitlam, Detached house | Water, sewer, garbage (small cart) | $1,661 | $138 | $370 | City of Coquitlam |
| Coquitlam, Townhouse or apartment | Water, sewer (no city garbage) | $1,088 | $91 | $138 | City of Coquitlam |
| North Vancouver (City), Detached house | Water and sewer only | $1,613 | $134 | $366 | City of North Vancouver |
| North Vancouver (City), Townhouse or apartment | Water and sewer only | $982 | $82 | $129 | City of North Vancouver |
| Vancouver, Detached house | Water, sewer (flat rate; solid waste not included) | $867 water + $1,238 sewer | $175 | $407 | City of Vancouver |
- Richmond, Apartment: $137
- Richmond, Townhouse: $306
- Richmond, Detached house: $420
- Coquitlam, Apartment: $138
- Coquitlam, Townhouse: $269
- Coquitlam, Detached house: $370
- North Vancouver, Apartment: $129
- North Vancouver, Townhouse: $260
- North Vancouver, Detached house: $366
$1,088: Coquitlam's 2026 water and sewer charge for each apartment or townhouse unit, against a single-family charge that also covers garbage pickup. (City of Coquitlam, 2026)
City utilities, often a yearly water bill rather than monthly costs, are the part of total utilities most buyers forget, and they differ by dwelling type. Coquitlam charges $1,661 a year for a house with a small garbage cart and $1,088 for each multi-family unit (City of Coquitlam, 2026); the City of North Vancouver charges $1,613 for a single-unit home and $982 per multi-unit dwelling (City of North Vancouver, 2026). Richmond meters every house, and its average-use estimates run from $2,250.57 for a house to $1,083.11 for an apartment (City of Richmond, 2026). Delta's flat fees for a single-family home total $1,658 (City of Delta, 2026). The house and townhouse totals are upper-end: electricity averages every home of that type, electrically heated ones included, while gas averages gas users only, so a typical gas-heated house likely pays somewhat less.
City charges are climbing, driven by Metro Vancouver's regional water and sewage costs, as the Richmond and North Vancouver rate documents explain. In Vancouver a house on flat rates now pays $867 for water (City of Vancouver, 2026) and $1,238 for sewer (City of Vancouver, 2026), before solid waste. In a strata building, the city bill often goes to the corporation and is divided through the fee, so the condo maintenance fees by unit size and age already include part of it. Both are on our lists of the pros and cons of living in Richmond and living in Coquitlam.
What Do Households Spend on Utilities Across Canada by Province, Before Internet Costs and a Home Phone?
In 2023 the average Canadian household spent $2,907 on water, fuel and electricity, about $242 a month (Statistics Canada, 2023). Alberta households spent the most, $4,459 a year, and Quebec households the least, $1,851. BC households spent $2,444.
| Province | Water, fuel and electricity per year | Per month | Electricity | Natural gas | Water and sewage | Source |
|---|---|---|---|---|---|---|
| British Columbia | $2,444 | $204 | $1,186 | $683 | $490 | Statistics Canada |
| Alberta | $4,459 | $372 | $1,951 | $1,332 | $1,125 | Statistics Canada |
| Saskatchewan | $3,507 | $292 | $1,558 | $905 | $964 | Statistics Canada |
| Manitoba | $2,629 | $219 | $1,514 | $454 | $609 | Statistics Canada |
| Ontario | $3,193 | $266 | $1,299 | $1,016 | $697 | Statistics Canada |
| Quebec | $1,851 | $154 | $1,568 | $86 | $52 | Statistics Canada |
| New Brunswick | $3,338 | $278 | $2,471 | $73 | $420 | Statistics Canada |
| Nova Scotia | $3,353 | $279 | $1,951 | $54 | $307 | Statistics Canada |
| Prince Edward Island | $3,542 | $295 | $2,041 | n/a | $189 | Statistics Canada |
| Newfoundland and Labrador | $3,468 | $289 | $2,512 | n/a | $238 | Statistics Canada |
| Canada | $2,907 | $242 | $1,502 | $689 | $537 | Statistics Canada |
- Alberta: $372
- Prince Edward Island: $295
- Saskatchewan: $292
- Newfoundland and Labrador: $289
- Nova Scotia: $279
- New Brunswick: $278
- Ontario: $266
- Manitoba: $219
- British Columbia: $204
- Quebec: $154
- Reference line, Canada average: $242
$372: What the average Alberta household spent each month on water, fuel and electricity in 2023, the most of any province. (Statistics Canada, 2023)
These are survey averages for the average household, owners and those renting, houses and apartments, including those whose utilities are in the rent. They cover fuel costs, electricity and water, but not food, child care or home insurance. That is why BC's $204 a month sits between our apartment and house estimates. Quebec's low figure reflects cheap electricity, and Quebec households report only $52 a year for water and sewage as a separate expense.
Ontario households spent $3,193, above the national average. Wherever you live in Canada, use the survey as a check on the estimates above; the cost to rent or own moves far more by city. A first-time buyer moving from a rented apartment to a house should expect utilities to rise by more than the provincial average suggests, which is one more reason the income needed to buy a home in BC is higher than a mortgage calculator alone shows. Next to how expensive it is to live in Vancouver, utilities are one of the smaller lines of the cost of living, and costs vary widely by home type, so they are not one to skip.
Monthly utilities by Metro Vancouver city and home type
Monthly utilities by Metro Vancouver city and home type
Enter a monthly utility budget to see which city and home type combinations fit it. Totals add an estimated BC Hydro bill, a FortisBC gas bill for gas-heated houses and townhouses, and each city's 2026 utility charges, which cover water and sewer everywhere plus garbage or flood protection only where the row note says so. House and townhouse totals are upper-end estimates.
| City | Estimated total per month | Home type | Electricity per month | City utilities per month |
|---|---|---|---|---|
| Richmond (water, sewer, flood protection, garbage (metered, average use, net)) | $137 | Apartment | $47 | $90 |
| Richmond (water, sewer, flood protection, garbage (metered, average use, net)) | $306 | Townhouse (row house) | $105 | $128 |
| Richmond (water, sewer, flood protection, garbage (metered, average use, net)) | $420 | Detached house | $122 | $188 |
| Coquitlam (water, sewer, garbage for houses (small cart); water, sewer for multi-family) | $138 | Apartment | $47 | $91 |
| Coquitlam (water, sewer, garbage for houses (small cart); water, sewer for multi-family) | $269 | Townhouse (row house) | $105 | $91 |
| Coquitlam (water, sewer, garbage for houses (small cart); water, sewer for multi-family) | $370 | Detached house | $122 | $138 |
| North Vancouver (City) (water, sewer) | $129 | Apartment | $47 | $82 |
| North Vancouver (City) (water, sewer) | $260 | Townhouse (row house) | $105 | $82 |
| North Vancouver (City) (water, sewer) | $366 | Detached house | $122 | $134 |
| Vancouver (water, sewer (flat rate, unmetered house)) | $407 | Detached house | $122 | $175 |
Frequently Asked Questions
What is the average utility bill in Canada, and what are utilities per month in Canada by province?
It depends on the province. Statistics Canada's 2023 household spending survey puts water, fuel and electricity at $2,907 a year for the average Canadian household, about $242 a month, ranging from $154 a month in Quebec to $372 in Alberta. A detached house costs more than that average, an apartment less. (Statistics Canada, 2023)
How much are utilities in Canada for a condo compared with a house, and what is the average cost per month?
In Richmond, BC, our estimate is $137 a month for an apartment and an upper-end $420 for a detached house, counting electricity, gas where used, water, sewer and garbage. A BC apartment uses about 390 kWh of electricity a month against 970 kWh for a house, and many condo buildings pay gas and hot water through strata fees. (City of Richmond, 2026)
What is the average hydro bill in Vancouver and British Columbia per month?
At BC Hydro rates of April 1, 2025, before tax, a Vancouver apartment using the BC average of 390 kWh a month pays about $47, a townhouse about $105 and a detached house about $122. Rates rose a further 3.75% on April 1, 2026. (Hydro-Québec, 2025)
Are utilities cheaper in Winnipeg than in Edmonton?
For electricity, yes, which lowers the cost of living in Winnipeg against the cost of living in Edmonton. Winnipeg has the second-lowest bill of the 12 cities Hydro-Québec compares at 1,000 kWh, $105.33 a month after Montréal, against $220.02 in Edmonton, and a typical Winnipeg detached house pays about $107 against $157 in Edmonton. Alberta houses also burn the most natural gas in Canada, 123.5 GJ a year. (Hydro-Québec, 2025)
How much is the gas bill and heating cost for a house in British Columbia?
A gas-heated BC detached house uses about 7.7 GJ of natural gas a month on average. At FortisBC's Mainland rates effective July 1, 2026, that is about $110 a month before tax, and about $73 for a gas-heated townhouse. Winter months run well above the average and summer months below it. (FortisBC, 2026)
Do condos in Vancouver use gas or electric heat?
Mostly electric. Of 10,174 condo listings in the Greater Vancouver and Fraser Valley board areas that name a heating system, 67.9% name electric or baseboard heat, 21.3% a heat pump and only 10.5% natural gas. For houses, 50.2% name natural gas. (Strawhomes MLS data, 2026)
Are utilities included in rent in Ontario and BC, and how do they change the cost of rent?
Utilities may be included in the lease, or not: it depends on the building and the landlord, so read the lease before comparing the cost of rent. When utilities are included, the rent covers them; when they are not, budget from the estimates above. If you rent in Canada and pay your own hydro, a Toronto apartment runs about $96 a month and a Vancouver apartment $47. City water and sewer, such as North Vancouver's $982 a year per multi-unit dwelling, are billed to the owner. (Hydro-Québec, 2025)
What is the average electricity bill in Ontario, and what is a typical cost per month in Ontario for a house in Toronto or Ottawa?
Hydro-Québec's comparison of Toronto Hydro and Hydro Ottawa bills at April 2025 rates, before tax, puts a Toronto detached house at about $137 a month at Ontario's average use of 840 kWh, a Toronto apartment at $96 and an Ottawa detached house at $125. Most Ontario houses also pay a separate gas bill for heat. (Hydro-Québec, 2025)
Methodology
Electricity estimates read Hydro-Québec's published monthly bills for each city (rates in effect April 1, 2025, base rates, before tax, at 625, 750, 1,000, 2,000 and 3,000 kWh) at the average monthly use of each home type in that city's province, from Statistics Canada table 25-10-0061-01 (2021). Between published points we draw a straight line; below 625 kWh we extend the 625 to 750 kWh slope, which is an approximation for apartments. Apartment use is the household-weighted average of low-rise and high-rise apartments; townhouse means row or terrace housing. Suppressed Statistics Canada cells are left blank. Natural gas is priced in dollars for BC only, at FortisBC's Mainland residential rates effective July 1, 2026, and only for gas-heated houses and townhouses. City utility charges are 2026 rates published by each city; what they cover differs and is named in the table. Metro Vancouver totals add the Vancouver BC Hydro estimate (BC Hydro rates are the same across its service area), the FortisBC estimate and the city charge divided by 12. They are upper-end estimates for houses and townhouses: Statistics Canada's electricity average covers all homes of a type, including electrically heated ones, while its gas average covers gas-using households only, so adding the two overstates a typical gas-heated home. BC Hydro's lower step rate applies below about 675 kWh a month, so the extended slope makes Vancouver apartment bills run a few dollars low; Hydro-Québec's own higher tier starts at 40 kWh a day, so the straight-line Montréal townhouse figure may run a few dollars high. BC Hydro rates rose 3.75% on April 1, 2026, after the Hydro-Québec rate date. Heating shares come from Strawhomes MLS data: active and pending condo, townhouse and house listings in the Greater Vancouver and Fraser Valley board areas on November 18, 2026 that name at least one heating system, in areas with 30 or more such listings; baseboard can also mean hot-water baseboards. Household spending comes from Statistics Canada's 2023 Survey of Household Spending. The recency sweep covered Reddit, YouTube, TikTok and the web for the last 30 days; Statistics Canada table pages and the Richmond, Vancouver and Coquitlam rate documents were checked against saved copies because the pages load their figures by script or block automated readers.
Sources consulted: 24
Sources cited: 14
Data freshness: current year: 9, last year: 2, older: 3
Data range: 2021 energy use; 2023 household spending; electricity rates of April 1, 2025; 2026 gas and municipal rates; MLS listings on 2026-11-18
Research date: 2026-11-18
Update schedule: Yearly, after Hydro-Québec's next edition and each January's municipal rates
Limitations: Electricity use by home type is a provincial average from Statistics Canada's 2021 Households and the Environment Survey, applied to each city in that province; the bill is read from Hydro-Québec's published bills at 625, 750, 1,000, 2,000 and 3,000 kWh (straight line between points, the 625 to 750 kWh slope extended below 625 kWh), uses base rates in effect April 1, 2025 and excludes taxes and optional time-of-use plans. Natural gas is priced in dollars for BC only. Suppressed Statistics Canada cells (townhouses in Atlantic Canada and Manitoba) are left blank, not estimated. MLS heating shares are agent-entered listing fields. House and townhouse totals add a gas-user gas bill to an all-homes electricity average, so they are upper-end estimates. BC apartment bills may run a few dollars low (BC Hydro's lower step rate applies below about 675 kWh a month) and the Montréal townhouse figure a few dollars high (Hydro-Québec's 40 kWh a day tier).
Sources & References
- Hydro-Québec. "Comparison of Electricity Prices in Major North American Cities, rates in effect April 1, 2025." hydroquebec.com/data/documents-donnees/pdf/comparaison-prix-2025-en.pdf. Accessed 2026-11-18.
- Statistics Canada. "Table 25-10-0061-01, Household energy consumption, by type of dwelling, Canada and provinces (2021)." www150.statcan.gc.ca/t1/tbl1/en/tv.action?pid=2510006101. Accessed 2026-11-18.
- Statistics Canada. "Table 11-10-0222-01, Household spending, Canada, regions and provinces (2023)." www150.statcan.gc.ca/t1/tbl1/en/tv.action?pid=1110022201. Accessed 2026-11-18.
- FortisBC. "Residential natural gas rates, Mainland and Vancouver Island (effective July 1, 2026)." fortisbc.com/accounts/billing-rates/natural-gas-rates/residential-rates. Accessed 2026-11-18.
- City of Richmond. "2026 Utility Budgets and Rates (report to committee; Option 2 adopted in the 2026 rate bylaws)." citycouncil.richmond.ca/__shared/assets/2026_Utility_Budgets_and_Rates77948.pdf. Accessed 2026-11-18.
- City of Coquitlam. "Utility fee: 2026 utility rates." coquitlam.ca/538. Accessed 2026-11-18.
- City of North Vancouver. "2026 Utility Bill Information." cnv.org/-/media/City-of-North-Vancouver/Documents/Utility-Rates/2026-Utility-Bil. Accessed 2026-11-18.
- City of Vancouver. "2026 Annual Review of Water Rates and Water Works By-law Amendments (council report RTS 18253)." council.vancouver.ca/20251112/documents/spec1a.pdf. Accessed 2026-11-18.
- City of Vancouver. "2026 Annual Review of Sewer Rates (council report RTS 18249)." council.vancouver.ca/20251112/documents/spec1b.pdf. Accessed 2026-11-18.
- City of Delta. "Utilities: 2026 flat rate utility fees." delta.ca/services/property-taxes-utilities/utilities. Accessed 2026-11-18.
- Government of British Columbia. "Province takes action to keep electricity rates affordable (BC Hydro 3.75% increases April 1, 2025 and April 1, 2026)." news.gov.bc.ca/releases/2025ECS0011-000216. Accessed 2026-11-18.
- Strawhomes MLS data. "Active and pending condo listings, Greater Vancouver and Fraser Valley board areas." strawhomes.com/lower-mainland-condos-for-sale/. Accessed 2026-11-18.
- Strawhomes MLS data. "Active and pending townhouse listings, Greater Vancouver and Fraser Valley board areas." strawhomes.com/lower-mainland-townhouses-for-sale/. Accessed 2026-11-18.
- Strawhomes MLS data. "Active and pending house listings, Greater Vancouver and Fraser Valley board areas." strawhomes.com/mls/vancouver/. Accessed 2026-11-18.

Let's Chat! Looking for a REALTOR® who can exceed your expectations? Look no further than Richard Morrison! His mission is to serve without limit & provide solutions that cater to your core needs.
• 20+ Years of Experience
• Medallion Member
• RE/MAX Hall of Fame

Latest Properties Added
| Property | Size | Price | Date Listed |
|---|---|---|---|
| 4350 Locarno Crescent, Vancouver | 3,712 sqft | $5,998,000 | Nov 16, 2026 |
| 402 - 550 Eighth Street, New Westminster | 998 sqft | $428,000 | Nov 16, 2026 |
| 8464 Brooke Road, Delta | 4,268 sqft | $2,049,999 | Nov 16, 2026 |
| 104 - 2130 12th Avenue, Vancouver | 831 sqft | $739,888 | Nov 16, 2026 |
| 4810 Greentree Place, Burnaby | 1,673 sqft | $1,498,000 | Nov 17, 2026 |
| 70 - 10333 River Drive, Richmond | 1,487 sqft | $1,098,000 | Nov 16, 2026 |
| 304 - 7500 Granville Avenue, Richmond | 1,241 sqft | $659,000 | Nov 17, 2026 |
| A215 - 2099 Lougheed Highway, Port Coquitlam | 741 sqft | $419,900 | Nov 10, 2026 |
| 213 - 3229 St Johns Street, Port Moody | 660 sqft | $515,000 | Nov 17, 2026 |
| 2308 Edinburgh Street, New Westminster | 1,438 sqft | $829,000 | Nov 17, 2026 |
| 1001 - 2012 Fullerton Avenue, North Vancouver | 719 sqft | $425,000 | Nov 17, 2026 |
| 16143 9 Avenue, Surrey | 3,064 sqft | $1,298,000 | Nov 18, 2026 |
Start your search with Richard Morrison, Top Award Winning Vancouver Realtor
Contact Richard Morrison Top Vancouver Realtor today to find a Vancouver houses for sale and Vancouver condos for sale. Also check out Burnaby houses for sale or maybe Burnaby condos for sale. If you prefer North Shore, take a look at our listings in North Vancouver houses for sale and North Vancouver condos for sale.