Power of Sale Statistics in Ontario by Region, and How BC Compares (2026)
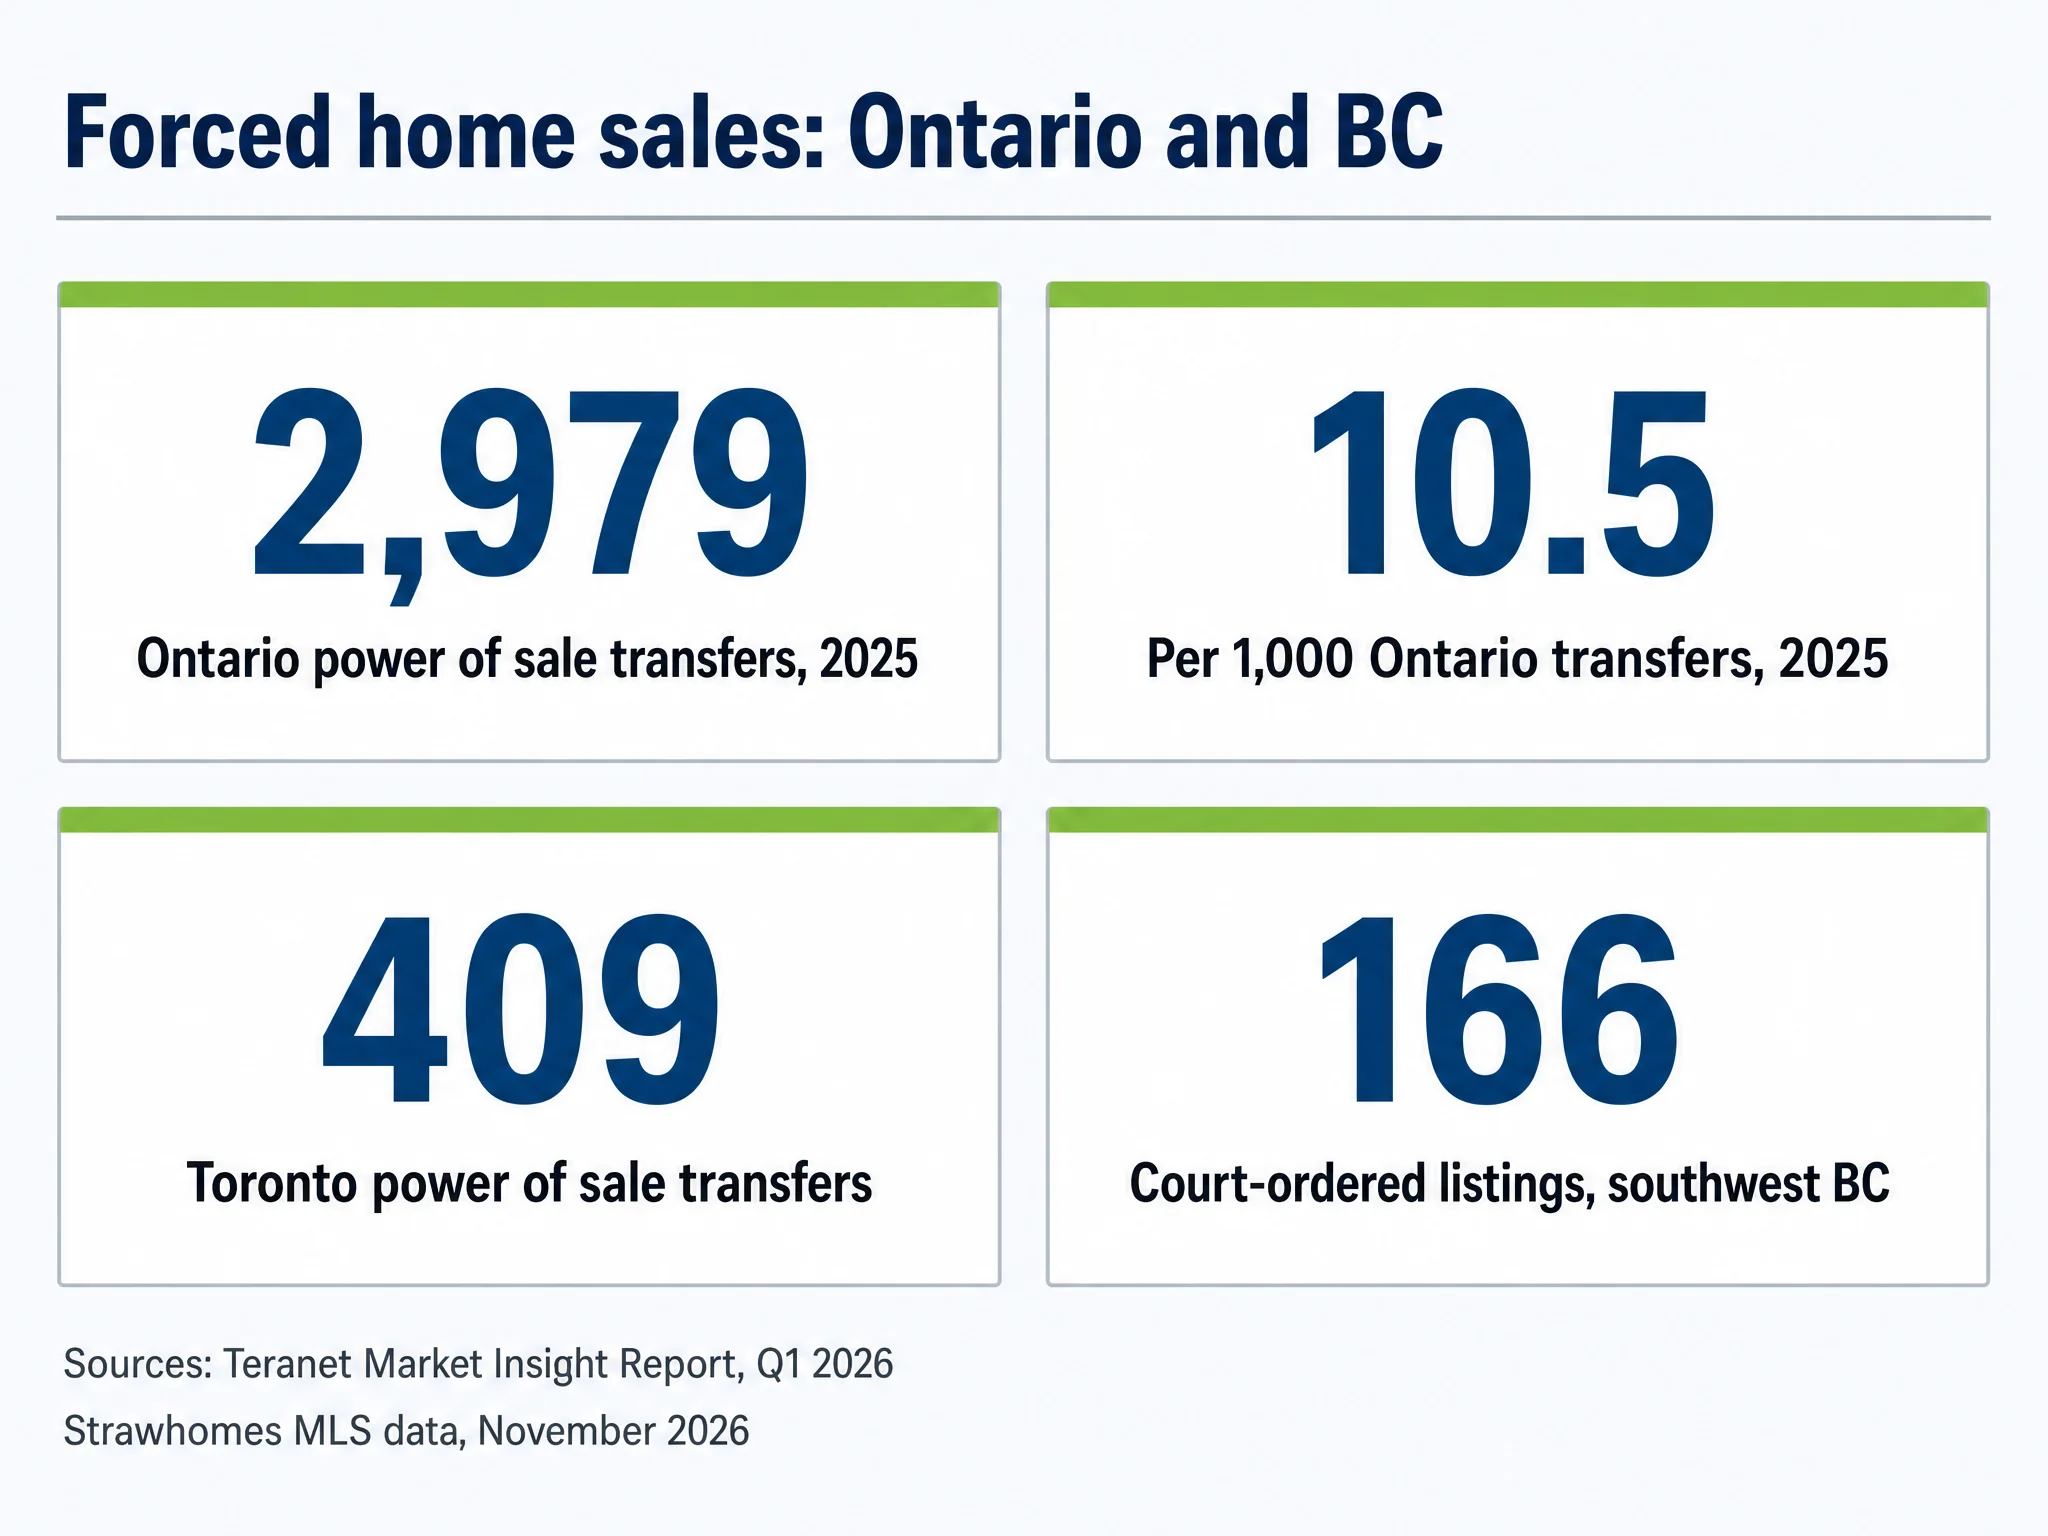
10.5: About 10.5 of every 1,000 Ontario property transfers in 2025 were power of sale transfers (2,979 of 284,636), up from 7.4 in 2024 and the highest rate since 2015. Source: Strawhomes calculation from Teranet Market Insight Report, Q1 2026 (2025)
Key Takeaways
- 2,979 Ontario power of sale transfers in 2025, up 40.3% from 2,123 in 2024, per Teranet's land registry count. (Teranet Market Insight Report, Q1 2026, 2025)
- 5.2 times Ontario's 2025 power of sale count against the 2022 low of 578; it is still 32.4% below the 4,410 of 2015. (Strawhomes calculation from Teranet Market Insight Report, Q1 2026, 2025)
- 8.4 Toronto power of sale transfers per 1,000 property transfers in 2025, below the 10.9 for the rest of Ontario. (Strawhomes calculation from Teranet Market Insight Report, Q1 2026, 2025)
- 36.2% Share of Ontario's 2025 power of sale transfers in Toronto, Peel, York and Durham; 38.7% came from outside the ten regions Teranet names. (Strawhomes calculation from Teranet Market Insight Report, Q1 2026, 2025)
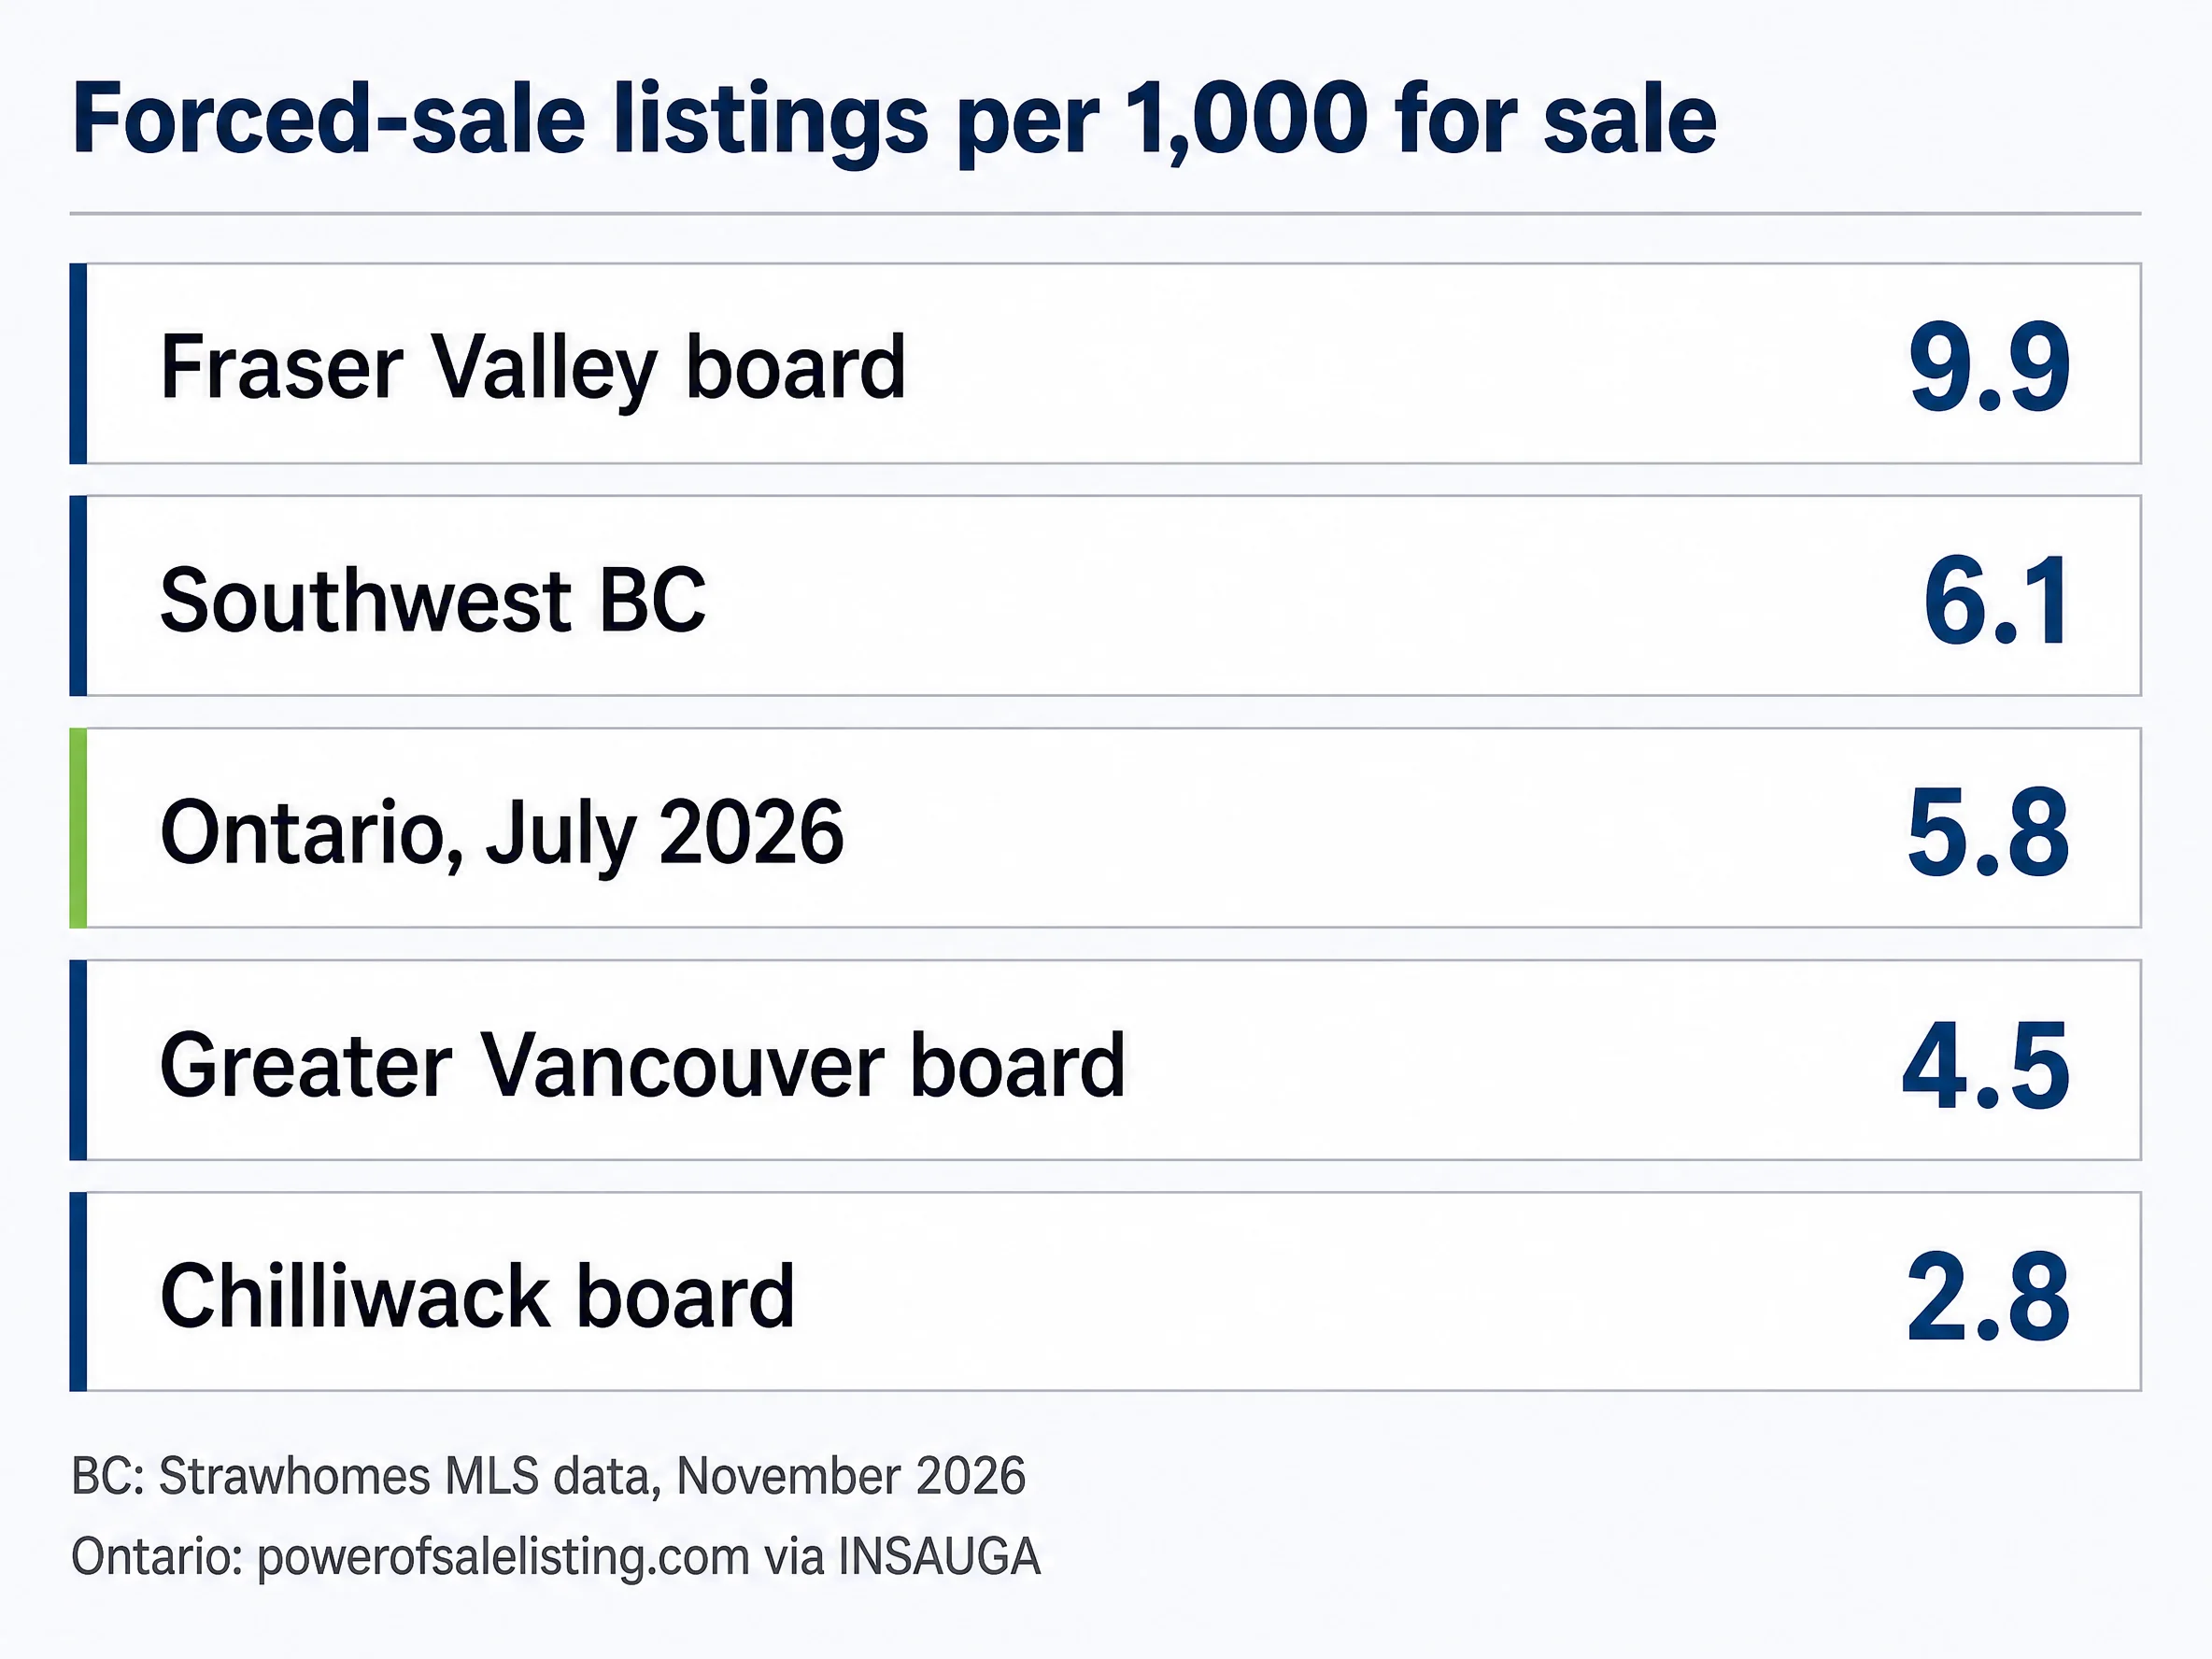
- 6.1 Court-ordered listings per 1,000 residential listings for sale in southwest BC on November 17, 2026 (166 of 27,141); Ontario's power of sale share in July 2026 was 5.8 per 1,000. (Strawhomes MLS data, 2026)
- 9.9 Court-ordered listings per 1,000 in the Fraser Valley board area, 2.2 times the Greater Vancouver board area rate of 4.5. (Strawhomes MLS data, 2026)
- 946 Court-ordered listings in Greater Vancouver and the Fraser Valley from January to September 2026, above any full year in the previous decade, as CBC News reported. (Yahoo Finance Canada (money.ca), citing CBC News, 2026)
Ontario lenders sold 2,979 properties through power of sale in 2025, about 10.5 of every 1,000 property transfers on the provincial land registry (Strawhomes calculation from Teranet Market Insight Report, Q1 2026, 2025). That rate of power-of-sale activity is the highest since 2015 and is up from 7.4 in 2024 and 1.8 at the 2022 low. Teranet, which runs the Ontario registry, publishes the count and the regional split, but not the rate. We calculated it, region by region where the data allows, and set it beside southwest BC, where lenders sell through the courts instead, to give a Canadian real estate comparison that neither province publishes.
Power of sale and foreclosure are not the same process, so the two provinces leave different trails. In Ontario a lender can sell a home under the mortgage's power of sale clause and register the transfer without a court order. In British Columbia a lender files a foreclosure petition and the BC Supreme Court approves the sale, which is why BC listings carry the words court-ordered. Our explainer on short sales versus foreclosure in BC covers the legal side. This article is about the numbers.
For BC we counted court-ordered listings in our own MLS feed for the Greater Vancouver, Fraser Valley and Chilliwack boards on November 17, 2026: 166 homes, or 6.1 per 1,000 residential listings (Strawhomes MLS data, 2026). Ontario's power of sale listings ran at 5.8 per 1,000 in July 2026 (INSAUGA, citing powerofsalelisting.com (July 30, 2026), 2026). The two listing shares are close, though BC's count includes court sales for every reason, and the pressure sits in the suburbs on both sides of Canadian housing.
How Many Power of Sale Transfers Did Ontario Record Each Year Since 2015? The Trend
Ontario recorded 2,979 power of sale transfers in 2025, up 40.3% from 2,123 in 2024 and 5.2 times the 2022 low of 578 (Teranet Market Insight Report, Q1 2026, 2025). Per 1,000 property transfers, the rate rose from 1.8 to 10.5, the highest since 2015.
| Year | Power of sale transfers | All property transfers | Per 1,000 transfers | Source |
|---|---|---|---|---|
| 2015 | 4,410 | 355,715 | 12.4 | Teranet Market Insight Report, Q1 2026 |
| 2016 | 3,712 | 377,385 | 9.8 | Teranet Market Insight Report, Q1 2026 |
| 2017 | 2,596 | 365,835 | 7.1 | Teranet Market Insight Report, Q1 2026 |
| 2018 | 2,096 | 319,973 | 6.6 | Teranet Market Insight Report, Q1 2026 |
| 2019 | 1,977 | 335,603 | 5.9 | Teranet Market Insight Report, Q1 2026 |
| 2020 | 1,472 | 353,894 | 4.2 | Teranet Market Insight Report, Q1 2026 |
| 2021 | 942 | 423,137 | 2.2 | Teranet Market Insight Report, Q1 2026 |
| 2022 | 578 | 328,682 | 1.8 | Teranet Market Insight Report, Q1 2026 |
| 2023 | 1,104 | 274,561 | 4.0 | Teranet Market Insight Report, Q1 2026 |
| 2024 | 2,123 | 286,658 | 7.4 | Teranet Market Insight Report, Q1 2026 |
| 2025 | 2,979 | 284,636 | 10.5 | Teranet Market Insight Report, Q1 2026 |
10.5: Power of sale transfers per 1,000 Ontario property transfers in 2025, the highest rate in a decade. (Strawhomes calculation from Teranet Market Insight Report, Q1 2026, 2025)
- 2015: 12.4
- 2016: 9.8
- 2017: 7.1
- 2018: 6.6
- 2019: 5.9
- 2020: 4.2
- 2021: 2.2
- 2022: 1.8
- 2023: 4.0
- 2024: 7.4
- 2025: 10.5
The series runs in a deep U. In 2015 Ontario still carried a tail of forced sales from the last downturn: 4,410 transfers, 12.4 per 1,000. A hot Toronto real estate market then let almost any owner in trouble sell on the open market at market value and keep the equity, so the count fell every year to 578 in 2022. When interest rates jumped and prices fell, that escape route closed for owners who bought near the 2021–2022 peak, and the count roughly doubled in each of the next two years, an increase not yet reversed. Our guide to how rising interest rates affect the housing market explains the chain from rate policy to monthly payments to forced sales.
The rate rose faster than the count. Total transfers fell from 423,137 in 2021 to 284,636 in 2025, so each power of sale became a larger slice of a thinner market. The 2025 count is still 32.4% below 2015, but the rate of 10.5 per 1,000 sits within reach of the 12.4 of that year. Teranet calls power of sale a small share of total transactions (Teranet Market Insight Report, Q1 2026, 2025); at roughly one sale in a hundred, that is accurate, and it is also the most it has been since the peak years of the last cycle.
Which Ontario Regions Had the Most Power of Sale Transfers in 2025: Toronto, Peel or the Rest of the GTA?
Toronto led with 409 power of sale transfers in 2025, then Peel with 276, York Region with 198, Durham with 194 and Simcoe with 187 (Teranet Market Insight Report, Q1 2026, 2025). Toronto, Peel, York and Durham held 36.2% of the total; 38.7% came from outside the ten regions Teranet names.
| Region | Transfers, 2025 | Share, 2025 | Share, 2024 | Source |
|---|---|---|---|---|
| Rest of Ontario | 1,153 | 38.7% | 40% | Teranet Market Insight Report, Q1 2026 |
| Toronto | 409 | 13.7% | 13% | Teranet Market Insight Report, Q1 2026 |
| Peel | 276 | 9.3% | 9% | Teranet Market Insight Report, Q1 2026 |
| York Region | 198 | 6.6% | 6% | Teranet Market Insight Report, Q1 2026 |
| Durham | 194 | 6.5% | 6% | Teranet Market Insight Report, Q1 2026 |
| Simcoe | 187 | 6.3% | 6% | Teranet Market Insight Report, Q1 2026 |
| Hamilton (Wentworth) | 135 | 4.5% | 4% | Teranet Market Insight Report, Q1 2026 |
| Middlesex | 122 | 4.1% | 6% | Teranet Market Insight Report, Q1 2026 |
| Niagara South | 115 | 3.9% | 4% | Teranet Market Insight Report, Q1 2026 |
| Essex | 99 | 3.3% | 4% | Teranet Market Insight Report, Q1 2026 |
| Ottawa-Carleton | 91 | 3.1% | 4% | Teranet Market Insight Report, Q1 2026 |
- Rest of Ontario: 1,153
- Toronto, Peel, York, Durham: 1,077
- Simcoe: 187
- Hamilton (Wentworth): 135
- Middlesex: 122
- Niagara South: 115
- Essex: 99
- Ottawa-Carleton: 91
38.7%: Share of Ontario power of sale transfers in 2025 that came from outside the ten regions Teranet names. (Strawhomes calculation from Teranet Market Insight Report, Q1 2026, 2025)
Teranet's regions are land registry divisions, so Wentworth means the Hamilton area and Niagara South the southern half of the Niagara peninsula. The ranking is mostly a ranking of size, which is why the share columns matter more than the counts. Peel's share held at about 9% in 2024 and 9.3% in 2025, Toronto edged up from 13% to 13.7%, and Middlesex, the London area, fell from 6% to 4.1% (Teranet Market Insight Report, Q1 2025, 2024).
The biggest single block is the rest of Ontario: 1,153 transfers in 2025 spread across smaller cities, cottage country and rural townships that do not make the top ten one by one. Power of sale is not only a Toronto condo story. It runs across Ontario, from the Greater Toronto Area into the commuter belt in Simcoe and Durham and the industrial southwest in Essex and Hamilton, where CMHC expects arrears to keep climbing (CMHC news release, October 27, 2026, 2026).
Is Toronto's Power of Sale Activity Higher Than the Rest of Ontario, per Property Transfer?
No. Toronto had 8.4 power of sale transfers per 1,000 property transfers in 2025, against 10.9 per 1,000 in the rest of Ontario (Strawhomes calculation from Teranet Market Insight Report, Q1 2026, 2025). Toronto made up 17.1% of all Ontario transfers but 13.7% of power of sales, so the city is under-represented, not over-represented.
| Measure | Value | Source |
|---|---|---|
| Toronto transfers, 2025 | 48,584 | Strawhomes calculation from Teranet Market Insight Report, Q1 2026 |
| Toronto power of sales, 2025 | 409 | Teranet Market Insight Report, Q1 2026 |
| Toronto per 1,000 | 8.4 | Strawhomes calculation from Teranet Market Insight Report, Q1 2026 |
| Rest of Ontario per 1,000 | 10.9 | Strawhomes calculation from Teranet Market Insight Report, Q1 2026 |
| Ontario per 1,000 | 10.5 | Strawhomes calculation from Teranet Market Insight Report, Q1 2026 |
| Toronto share of transfers | 17.1% | Strawhomes calculation from Teranet Market Insight Report, Q1 2026 |
| Toronto share of power of sales | 13.7% | Strawhomes calculation from Teranet Market Insight Report, Q1 2026 |
| Peel share of all transfers, 2024 | 7% | Teranet Market Insight Report, Q1 2025 |
| Middlesex share of all transfers, 2024 | 3% | Teranet Market Insight Report, Q1 2025 |
- Toronto 2025, Share of all transfers: 17.1
- Toronto 2025, Share of power of sales: 13.7
- Peel 2024, Share of all transfers: 7.0
- Peel 2024, Share of power of sales: 9.0
- Middlesex 2024, Share of all transfers: 3.0
- Middlesex 2024, Share of power of sales: 6.0
Teranet only publishes total transfer counts for Ontario and for Toronto, so Toronto is the one region where a true rate can be calculated. The answer runs against the usual story. With condos at 62.7% of its transfers (Strawhomes calculation from Teranet Market Insight Report, Q1 2026, 2025), Toronto's forced sales rose, but its rate stayed below the provincial figure. Teranet adds that Toronto and Peel buying is dominated by first-time buyers and multi-property owners. The rest of the province, at 10.9 per 1,000, carries the heavier load.
Teranet's 2024 report hints at where that load sits. Peel produced 9% of power of sale transfers that year but only 7% of all transfers, and Middlesex 6% against 3% (Teranet Market Insight Report, Q1 2025, 2024). Both regions were over-represented by more than their size explains. One reading is that suburban and mid-size-city owners with large mortgages are more exposed than downtown condo owners, though Teranet does not publish the split by property type for each region.
How Many Power of Sale Listings and Homes for Sale Are on the Ontario Real Estate Market in 2026?
Power of sale listings made up 0.58% of Ontario homes for sale in July 2026, or 5.8 per 1,000, as INSAUGA reported from powerofsalelisting.com (INSAUGA, citing powerofsalelisting.com (July 30, 2026), 2026). Toronto had 170 such listings, York Region 111 and Peel Region 108, with Brampton at 64 and Mississauga at 33.
| Area | Power of sale listings, July 2026 | Source |
|---|---|---|
| Ontario share of homes for sale | 0.58% | INSAUGA, citing powerofsalelisting.com (July 30, 2026) |
| Ontario per 1,000 for sale | 5.8 | Strawhomes calculation from INSAUGA, citing powerofsalelisting.com |
| Toronto | 170 | INSAUGA, citing powerofsalelisting.com (July 30, 2026) |
| York Region | 111 | INSAUGA, citing powerofsalelisting.com (July 30, 2026) |
| Peel Region | 108 | INSAUGA, citing powerofsalelisting.com (July 30, 2026) |
| Brampton | 64 | INSAUGA, citing powerofsalelisting.com (July 30, 2026) |
| Mississauga | 33 | INSAUGA, citing powerofsalelisting.com (July 30, 2026) |
Listings are a snapshot, not a yearly flow, and the two measures answer different questions. Teranet's 2,979 counts homes whose sale closed and was registered in 2025. A listing count shows what is listed on one day, including homes that will sell, be withdrawn, or be redeemed by the owner before the lender closes. The listing share is the better comparison with BC, because BC court-ordered sales are visible in MLS listings, not in a public registry count.
Brampton's 64 listings against Mississauga's 33 shows where most of Peel's pressure sits. For buyers, a power of sale listing is an ordinary MLS listing with a motivated seller, the lender, which must take reasonable care to get fair market value. A real estate agent or REALTOR® can help you make an offer. Our page of motivated seller listings shows what that looks like on the BC side.
How Do Southwest BC Court-Ordered Listings and Asking Prices Compare per 1,000 Homes for Sale?
On November 17, 2026, southwest BC had 166 court-ordered listings among 27,141 residential listings, 6.1 per 1,000, counting court sales for every reason, not only mortgage defaults (Strawhomes MLS data, 2026). The Fraser Valley board area ran at 9.9 per 1,000, 2.2 times the Greater Vancouver rate of 4.5. Ontario's power of sale share in July 2026 was 5.8.
| MLS area | Court-ordered listings | Listings for sale | Per 1,000 | Median asking price (nearest $100) | Source |
|---|---|---|---|---|---|
| Surrey | 25 | 1,508 | 16.6 | $1,329,000 | Strawhomes MLS data |
| Vancouver East | 18 | 1,929 | 9.3 | $1,122,400 | Strawhomes MLS data |
| Vancouver West | 15 | 3,301 | 4.5 | $2,799,000 | Strawhomes MLS data |
| North Surrey | 14 | 1,350 | 10.4 | $947,000 | Strawhomes MLS data |
| South Surrey and White Rock | 12 | 1,422 | 8.4 | $1,454,500 | Strawhomes MLS data |
| Langley | 11 | 1,603 | 6.9 | $1,235,000 | Strawhomes MLS data |
| Richmond | 9 | 2,054 | 4.4 | $1,549,000 | Strawhomes MLS data |
| Cloverdale | 9 | 509 | 17.7 | $1,278,000 | Strawhomes MLS data |
| Abbotsford | 7 | 1,228 | 5.7 | $1,000,000 | Strawhomes MLS data |
| Maple Ridge | 6 | 885 | 6.8 | $1,197,900 | Strawhomes MLS data |
| New Westminster | 6 | 641 | 9.4 | $1,500,000 | Strawhomes MLS data |
| West Vancouver | 5 | 643 | 7.8 | $2,680,000 | Strawhomes MLS data |
- Cloverdale: 17.7
- Surrey: 16.6
- North Surrey: 10.4
- New Westminster: 9.4
- Vancouver East: 9.3
- South Surrey/White Rock: 8.4
- West Vancouver: 7.8
- Langley: 6.9
- Maple Ridge: 6.8
- Abbotsford: 5.7
- Vancouver West: 4.5
- Richmond: 4.4
- Reference line, Ontario power of sale listings, July 2026: 5.8
9.9: Court-ordered listings per 1,000 residential listings in the Fraser Valley board area, November 17, 2026. (Strawhomes MLS data, 2026)
Central Surrey, the MLS area that takes in Newton, Fleetwood and Panorama, had 25 court-ordered listings, 16.6 per 1,000, and Cloverdale had the highest rate at 17.7. North Surrey added 14. Across Surrey's four MLS areas the share is well above Ontario's, while Vancouver West, Richmond and the Tri-Cities sit below it. The Surrey market stats track prices and inventory in the same suburbs each month, and our current foreclosure listings page shows many of these homes.
The stock is mostly houses, not the condo or benchmark townhouse: 105 of the 166 court-ordered listings, or 63.3%, are detached, against 37 condos and 19 townhouses. The flow is rising too. CBC News counted 946 court-ordered listings in Greater Vancouver and the Fraser Valley from January to September 2026, more than in any full year of the previous decade, as Yahoo Finance Canada reported (Yahoo Finance Canada (money.ca), citing CBC News, 2026). Our own count is a one-day snapshot, so it cannot be set against that nine-month total. The Vancouver market stats and Langley market stats track the wider market each month.
What Do Mortgage Arrears Say About the Ontario Housing Market and Forced Sales in 2026 and 2027?
CMHC put Ontario's mortgage arrears rate at 0.32% in the second quarter of 2026 and expects it to rise through mid-2027 (CMHC news release, October 27, 2026, 2026). Equifax data showed Ontario's mortgage balance delinquency rate (90+ days past due) at 0.36% in early 2026, up 52% in a year, and BC's at 0.25%, up 36% (Yahoo Finance Canada (money.ca), citing Equifax Canada, 2026).
| Measure | Value | Source |
|---|---|---|
| Ontario arrears, Q2 2026 (CMHC) | 0.32% | CMHC news release, October 27, 2026 |
| Ontario delinquency, Q1 2026 | 0.36% | Yahoo Finance Canada (money.ca), citing Equifax Canada |
| Ontario delinquency, Q1 2025 | 0.24% | Yahoo Finance Canada (money.ca), citing Equifax Canada |
| Ontario change, one year | 52% | Yahoo Finance Canada (money.ca), citing Equifax Canada |
| BC delinquency, Q1 2026 | 0.25% | Yahoo Finance Canada (money.ca), citing Equifax Canada |
| BC change, one year | 36% | Yahoo Finance Canada (money.ca), citing Equifax Canada |
- Ontario, Q1 2025: 0.24
- Ontario, Q1 2026: 0.36
- BC, Q1 2026: 0.25
Arrears lead forced sales by months. A borrower falls behind, the lender sends notice, and in Ontario a power of sale cannot close until the notice period runs out; in BC the court sets a redemption period first. So the arrears rising through 2026 are likely to show up as the power of sale transfers and court-ordered listings of late 2026 and 2027. CMHC expects the largest and most sustained rise in Ontario, concentrated in the GTHA and southwestern Ontario, and a more moderate rise in BC. Its deputy chief economist was clear that "Canada is not facing a broad mortgage crisis" (CMHC news release, October 27, 2026, 2026).
Both things are true for Canadian housing over the last 12 months. A rate of 10.5 per 1,000 transfers is small. But it is the most in a decade, and it is concentrated: Peel and Middlesex in Ontario in 2024, Surrey and Cloverdale in BC now. For buyers it means more choice of motivated sellers. Our guide to buying a house in a recession and to how a short sale works cover what to expect. For owners near the edge, selling early, before a lender takes conduct of sale, usually keeps more of the equity.
Court-Ordered Listing Checker: Which Southwest BC Areas Have Them Within Your Budget?
Court-Ordered Listing Checker: Which Southwest BC Areas Have Them Within Your Budget?
Enter a budget to see the southwest BC MLS areas where the median asking price of court-ordered listings is at or below it, with each area's count and rate per 1,000 listings. Strawhomes MLS data, November 17, 2026; areas with at least five court-ordered listings.
| MLS area | Median asking price (nearest $100) | Court-ordered listings | Per 1,000 listings |
|---|---|---|---|
| North Surrey (Fraser Valley board area) | $947,000 | 14 | 10.4 |
| Abbotsford (Fraser Valley board area) | $1,000,000 | 7 | 5.7 |
| Vancouver East (Greater Vancouver board area) | $1,122,400 | 18 | 9.3 |
| Maple Ridge (Greater Vancouver board area) | $1,197,900 | 6 | 6.8 |
| Langley (Fraser Valley board area) | $1,235,000 | 11 | 6.9 |
| Cloverdale (Fraser Valley board area) | $1,278,000 | 9 | 17.7 |
| Surrey (Fraser Valley board area) | $1,329,000 | 25 | 16.6 |
| South Surrey and White Rock (Fraser Valley board area) | $1,454,500 | 12 | 8.4 |
| New Westminster (Greater Vancouver board area) | $1,500,000 | 6 | 9.4 |
| Richmond (Greater Vancouver board area) | $1,549,000 | 9 | 4.4 |
| West Vancouver (Greater Vancouver board area) | $2,680,000 | 5 | 7.8 |
| Vancouver West (Greater Vancouver board area) | $2,799,000 | 15 | 4.5 |
November 2026 Update: Using This Data Analysis by City and Municipality
Teranet reports power of sale by land registry division, which rarely matches a single city or municipality, while the listing counts follow city and region names. To track one area, compare its share of power of sales with its share of all property transfers; a share well above its size, as with Peel and Middlesex in 2024, is the warning sign. A rising count in a shrinking market says less.
In BC, every court-ordered listing in this snapshot is on the MLS with an asking price and a court approval process, and our foreclosure listings page shows current court-ordered homes. We plan to repeat it each quarter and add Teranet's 2026 count when it is published.
Frequently Asked Questions
How many power of sale transfers were there in Ontario in 2025?
Teranet counted 2,979 power of sale transfers on the Ontario land registry in 2025, up 40.3% from 2,123 in 2024 and 5.2 times the 2022 low of 578. That is about 10.5 of every 1,000 property transfers, the highest rate since 2015, when it was 12.4. (Strawhomes calculation from Teranet Market Insight Report, Q1 2026, 2025)
Which Ontario regions in and around the GTA have the most power of sale activity?
In 2025 Toronto had the most, with 409 power of sale transfers, followed by Peel (276), York Region (198), Durham (194) and Simcoe (187), per Teranet. Toronto, Peel, York and Durham held 36.2% of the provincial total, and 38.7% came from outside the ten regions Teranet names. (Teranet Market Insight Report, Q1 2026, 2025)
What share of Ontario real estate sales are power of sale?
About 10.5 in every 1,000 Ontario property transfers in 2025 were power of sale, or roughly one percent, based on Teranet's registry counts. Among homes listed for sale in July 2026, power of sale listings were 0.58% of the total, as INSAUGA reported from powerofsalelisting.com. (Strawhomes calculation from Teranet Market Insight Report, Q1 2026, 2025)
Is power of sale still increasing in Ontario as of the October 2026 data?
Recent data points up. Equifax put Ontario's mortgage delinquency rate at 0.36% in the first quarter of 2026, up from 0.24% a year earlier, and CMHC reported Ontario arrears at 0.32% in the second quarter and expects them to keep rising through mid-2027. Teranet has not yet published a 2026 power of sale count. (CMHC news release, October 27, 2026, 2026)
How common are court-ordered sales in BC compared with Ontario?
On November 17, 2026, Strawhomes MLS data showed 166 court-ordered listings among 27,141 residential listings for sale in southwest BC, or 6.1 per 1,000. Ontario's power of sale share in July 2026 was 5.8 per 1,000 listings. The Fraser Valley board area was higher, at 9.9 per 1,000. (Strawhomes MLS data, 2026)
Where in Metro Vancouver and the Fraser Valley are court-ordered listings most common?
Central Surrey had the most court-ordered listings on November 17, 2026, with 25, or 16.6 per 1,000 listings, and Cloverdale had the highest rate at 17.7 per 1,000. Vancouver East had 18 and North Surrey 14, per Strawhomes MLS data. (Strawhomes MLS data, 2026)
Which city or municipality in the GTA has the most power of sale listings?
In July 2026 the City of Toronto had 152 power of sale listings, Brampton 64, Mississauga 33, Markham 31, Hamilton 26 and Vaughan 24, as INSAUGA reported from powerofsalelisting.com. By region, Toronto had 170, York Region 111 and Peel Region 108. (INSAUGA, citing powerofsalelisting.com (July 30, 2026), 2026)
Are forced sales in Toronto higher than in the rest of Ontario?
Not as a rate. Toronto had the most power of sale transfers in 2025, 409, but that was only 8.4 per 1,000 of its 48,584 property transfers. The rest of Ontario ran at 10.9 per 1,000, based on Teranet's counts. Toronto held 17.1% of all transfers but 13.7% of power of sales. (Strawhomes calculation from Teranet Market Insight Report, Q1 2026, 2025)
Methodology
Ontario figures come from Teranet's Market Insight Reports for Q1 2026 (data for 2015 to 2025) and Q1 2025 (regional shares for 2024). Teranet publishes the yearly power of sale counts and the regional split in charts; we read the values from the chart data embedded in the report pages and checked that the regional counts sum to the provincial total. The rate per 1,000 divides power of sale transfers by Teranet's condo plus non-condo transfers for the same year; Teranet's 2024 transfer count was revised slightly between reports, and we use the newer one. Regional rates are given only for Toronto, the one region with a published transfer total. Ontario listing figures are from INSAUGA's July 2026 report of powerofsalelisting.com data. The BC count is Strawhomes MLS data for the Greater Vancouver, Fraser Valley and Chilliwack boards, pulled read-only on November 17, 2026: residential and residential income listings for sale (active and pending), flagged court-ordered when the public remarks say court-ordered, court order, order of the court, court approval, foreclosure or judicial sale, and excluded when they say court approval is not required. It includes court sales for every reason, such as estates and family law cases as well as mortgage defaults. Listings that leave the market keep no remarks in our database, so we cannot publish a BC sold series; the BC rate is a one-day stock, the Ontario rate a yearly flow. Equifax and CBC figures are as reported by Yahoo Finance Canada. No research stage ran degraded.
Sources consulted: 14
Sources cited: 6
Data freshness: current year: 4, last year: 1, older: 1
Data range: 2015 to 2025 (Teranet registry); July 2026 (Ontario listings); November 17, 2026 (Strawhomes MLS snapshot)
Research date: 2026-11-17
Update schedule: Yearly, after each Teranet Q1 report; BC snapshot quarterly
Limitations: Ontario counts are registered transfers (a flow over a year); the BC figures are listings for sale on one day (a stock). Teranet publishes regional power of sale counts but regional total transfers only for Toronto, so other regional rates cannot be computed. BC court-ordered listings are identified from listing remarks, and Strawhomes keeps no remarks on listings once they leave the market, so no BC sold series is published here.
Sources & References
- Teranet. "Market Insight Report Q1 2026: An Overview of Ontario's Housing Market in 2025." teraintelligence.teranet.ca/market_insights/market-insights-q1-2026/. Accessed 2026-11-17.
- Teranet. "Market Insight Report Q1 2025: A Review of Ontario's Housing Market in 2024." teraintelligence.teranet.ca/market_insights/market-insights-q1-2025/. Accessed 2026-11-17.
- Strawhomes MLS data. "Court-ordered and foreclosure listings, southwest BC (GVR, FVREB and Chilliwack board feed), November 17, 2026." strawhomes.com/mls/tag/foreclosure/. Accessed 2026-11-17.
- Yahoo Finance Canada (money.ca). "Court-ordered home sales hit a 10-year high in B.C., and Ontario mortgage delinquencies jumped 52%." ca.finance.yahoo.com/news/court-ordered-home-sales-hit-100000024.html. Accessed 2026-11-17.
- INSAUGA. "Ontario cities that have the most default mortgage homes for sale." insauga.com/ontario-cities-that-have-the-most-default-mortgage-homes-for-sale/. Accessed 2026-11-17.
- CMHC. "Ontario mortgage arrears expected to rise through mid-2027." cmhc-schl.gc.ca/media-newsroom/news-releases/2026/ontario-mortgage-arrears-expec. Accessed 2026-11-17.

Let's Chat! Looking for a REALTOR® who can exceed your expectations? Look no further than Richard Morrison! His mission is to serve without limit & provide solutions that cater to your core needs.
• 20+ Years of Experience
• Medallion Member
• RE/MAX Hall of Fame

Latest Properties Added
| Property | Size | Price | Date Listed |
|---|---|---|---|
| 6842 131 Street, Surrey | 3,892 sqft | $1,449,999 | Nov 13, 2026 |
| 19683 74 Avenue, Langley | 2,485 sqft | $1,249,900 | Nov 18, 2026 |
| 1001 - 2012 Fullerton Avenue, North Vancouver | 719 sqft | $425,000 | Nov 17, 2026 |
| 2358 Cape Horn Road, Coquitlam | 2,734 sqft | $1,379,000 | Nov 16, 2026 |
| 2 - 2755 11th Avenue, Vancouver | 1,560 sqft | $2,498,000 | Nov 17, 2026 |
| 1702 - 5883 Barker Avenue, Burnaby | 768 sqft | $749,000 | Nov 17, 2026 |
| 300 - 1226 Hamilton Street, Vancouver | 612 sqft | $597,000 | Nov 17, 2026 |
| 411 - 4909 Elliott Street, Delta | 1,083 sqft | $959,900 | Nov 17, 2026 |
| 7660 Malahat Avenue, Richmond | 3,586 sqft | $3,580,000 | Nov 16, 2026 |
| 3088 144 Street, Surrey | 6,501 sqft | $3,080,000 | Nov 13, 2026 |
| 8069 124 Street, Surrey | 3,457 sqft | $1,738,000 | Nov 16, 2026 |
| 34 - 5900 Muir Drive, Richmond | 1,366 sqft | $718,000 | Nov 16, 2026 |
Start your search with Richard Morrison, Top Award Winning Vancouver Realtor
Contact Richard Morrison Top Vancouver Realtor today to find a Vancouver houses for sale and Vancouver condos for sale. Also check out Burnaby houses for sale or maybe Burnaby condos for sale. If you prefer North Shore, take a look at our listings in North Vancouver houses for sale and North Vancouver condos for sale.